Crypto markets threw a nice head fake this week by rallying into resistance on a “positive” Consumer Price Index (CPI) report, before retracing the majority of those gains right after Federal Reserve Chair Jerome Powell took on a surprisingly hawkish tone during his post-rate-hike presser.
The Fed hiked interest rates by 0.50%, which was well within the expectation of most market participants, but the eyebrow-raiser was the Federal Open Market Committee consensus that rates would need to reach the 5%–5.5%+ range in order to hopefully achieve the Fed’s 2% inflation target.
This basically threw cold water on traders’ lusty dreams of a Fed policy pivot taking place in the first half of 2023, and the damper on sentiment was felt throughout crypto and equities markets.
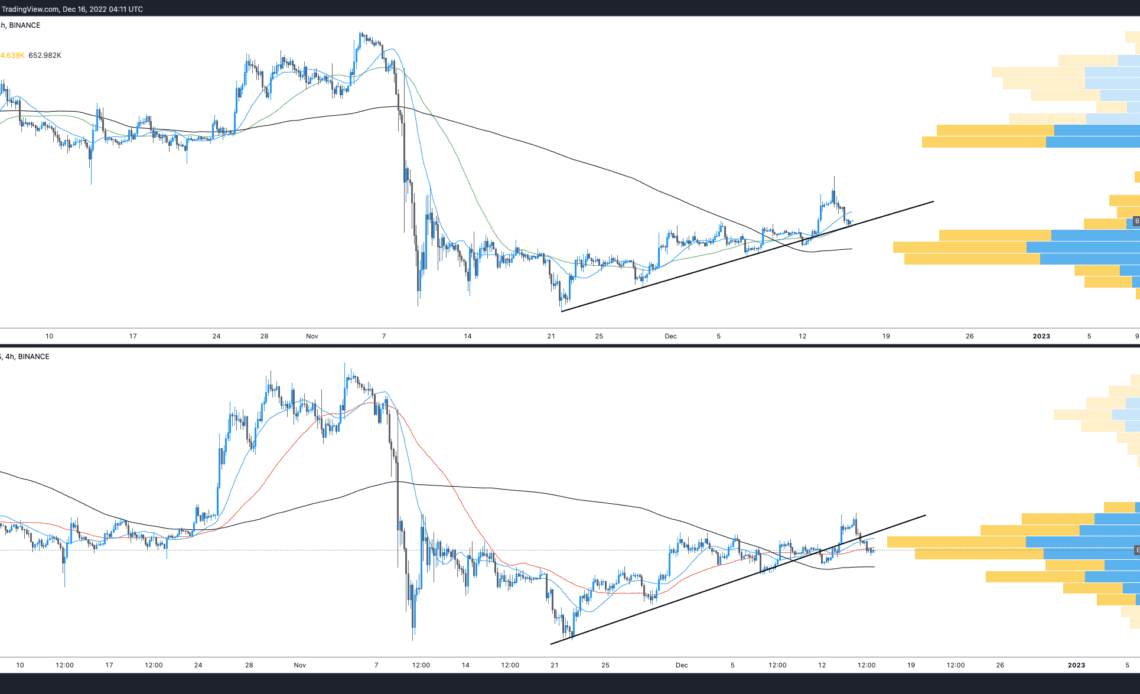
As the charts below show, Bitcoin (BTC) and Ether (ETH) reversed course right as Powell began his presser on Dec. 14.
How do you like them apples?
It’s also not surprising that BTC and ETH price action and market structure on the lower time frames also look identical.
So, yes, markets retraced their recent gains over bad news, but has anything actually “changed?” Bitcoin is still trading with a clear range; Ether is doing the same, and neither asset has made new yearly lows recently.
As the saying goes, when in doubt, zoom out. So, let’s do that briefly and take a better look at the lay of the land.
When in doubt, zoom out!
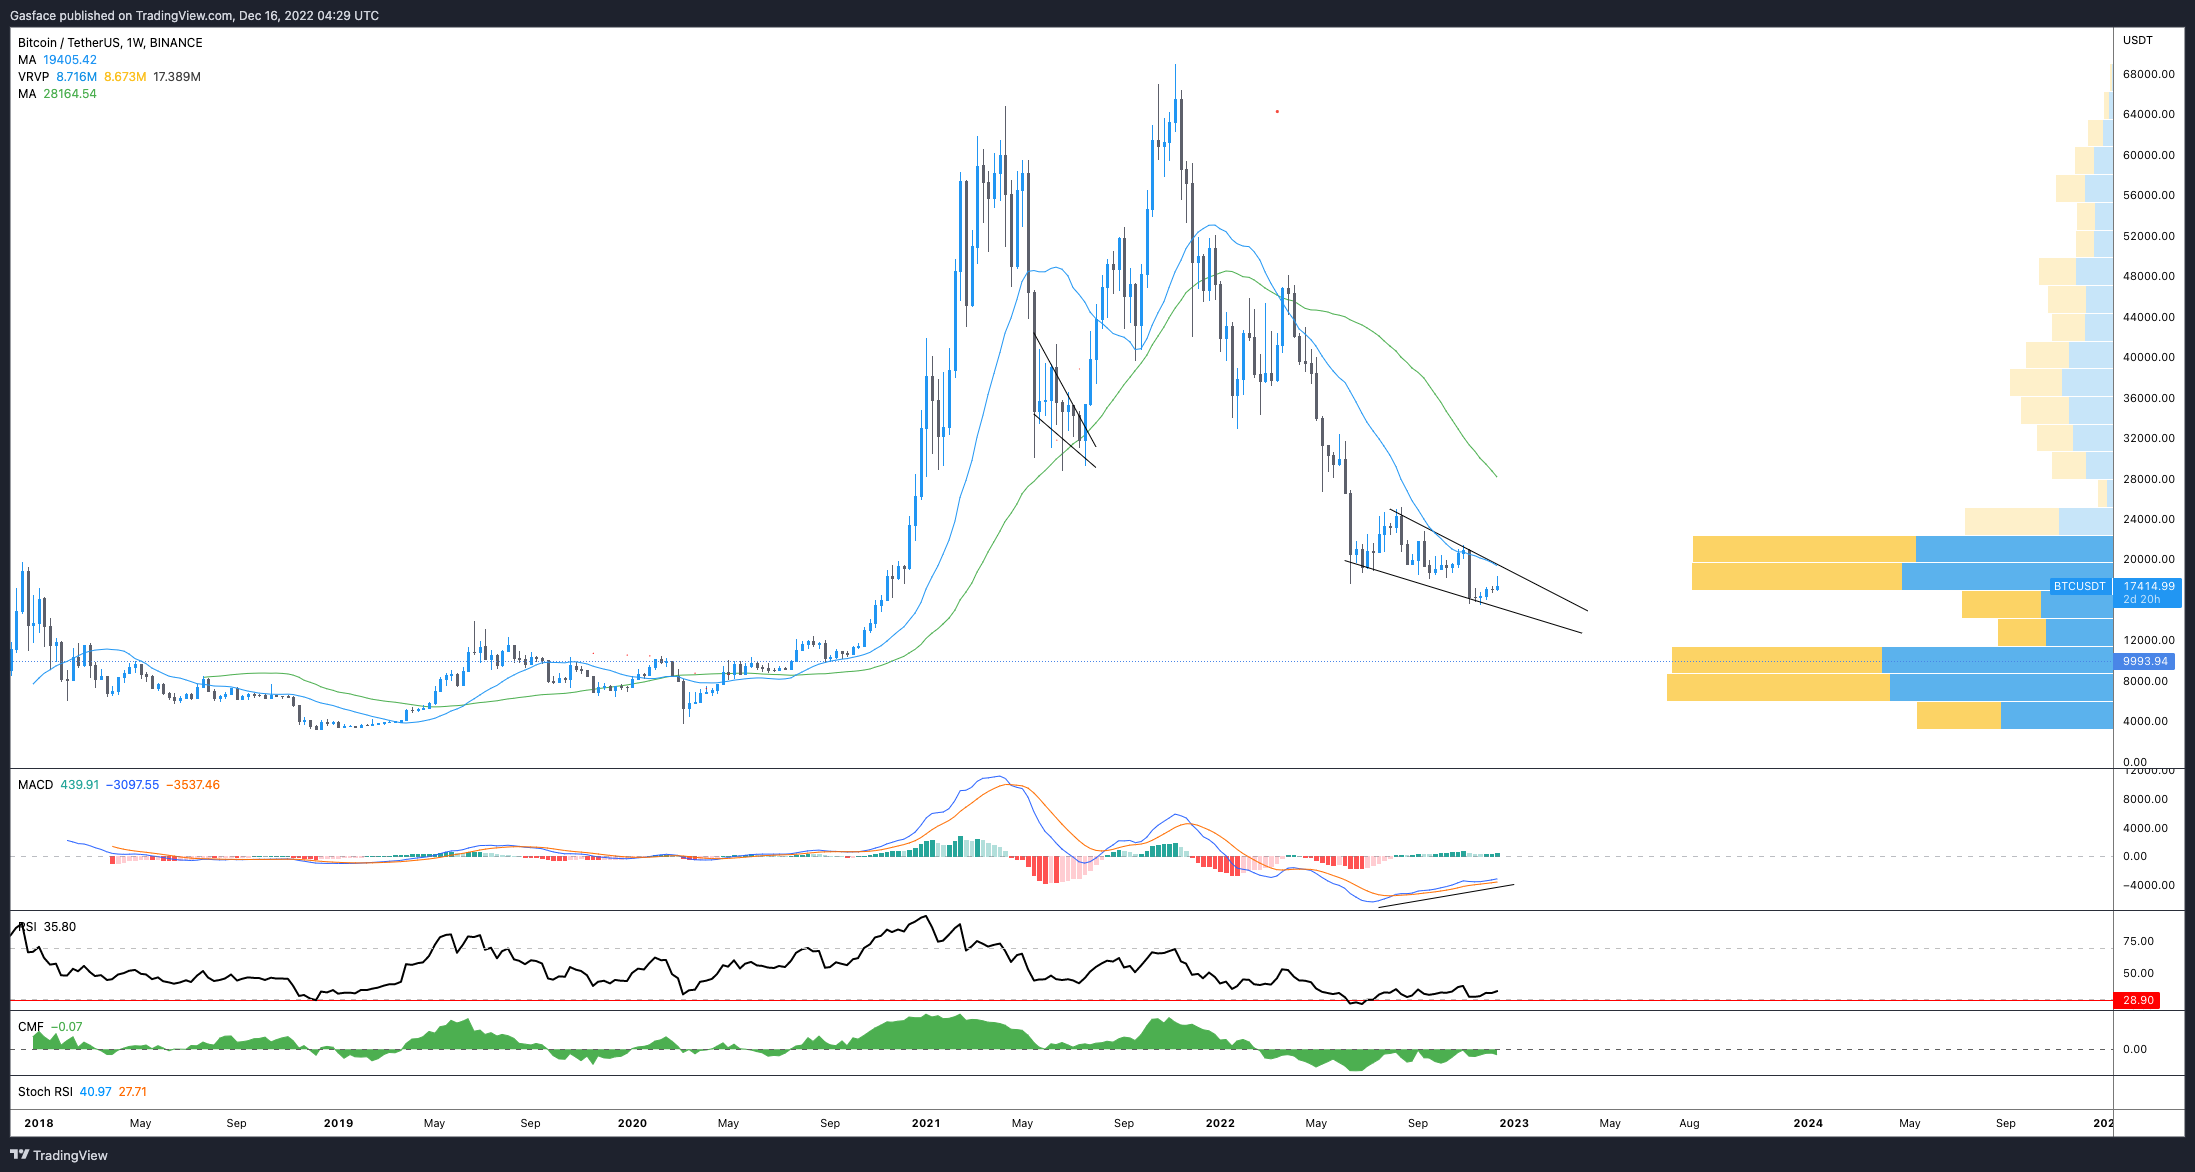
On the weekly timeframe, Bitcoin is still bouncing around in a falling wedge, a classic technical analysis pattern that tends to lean bullish. The price is doing pretty much what one would expect the price to do within the framework of technical analysis.
There’s expected resistance at the 20-MA, which is lined up with the descending trendline. The volume profile metric shows a bulk of activity in the $18,000–$22,500 range, and the lower arm of the falling wedge has so far functioned as support.
Similar price action was seen in May 2021–July 2021, but of course, the situations were entirely different, so that’s a bit of an apples-to-oranges comparison. There’s a divergence on the MACD and RSI. In short, the price is trending down, and MACD and RSI are trending up on the weekly timeframe, which is possibly something worth keeping an eye on.
What I like about the weekly timeframe is that candles form slowly, and trends, whether bullish or bearish, are…
Click Here to Read the Full Original Article at Cointelegraph.com News…