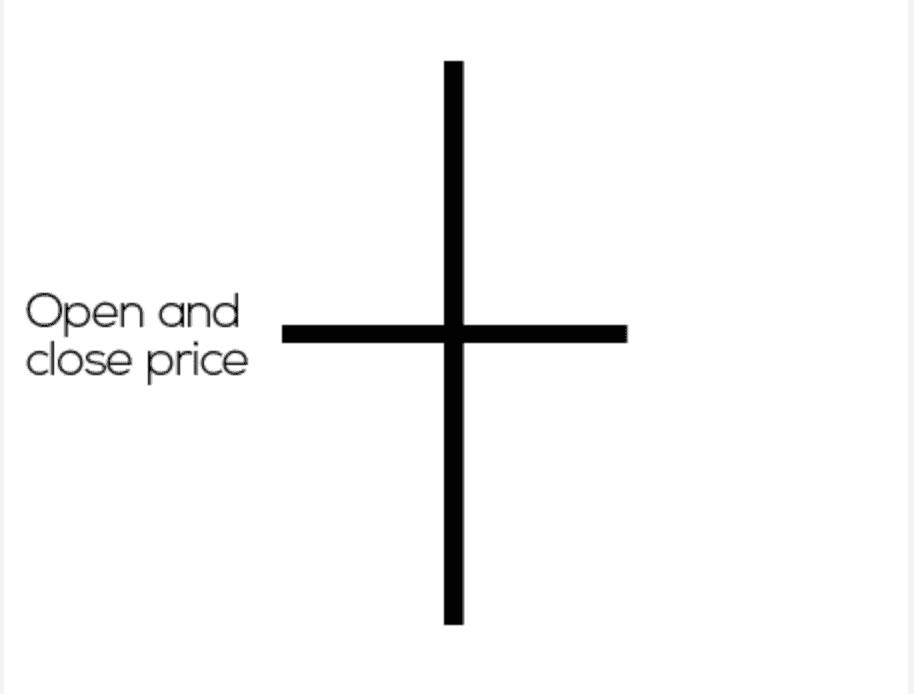
The Doji candlestick, also called a Doji star, shows indecision between buyers and sellers in the crypto market. This type of candlestick is confirmed on a technical analysis chart when the opening and closing prices are almost identical.
What is a Doji pattern on the candlestick chart?
In simple terms, a Doji shows that an asset’s buyers and sellers offset each other. In doing so, any attempts to push up the price by the buyers get thwarted by the sellers. Similarly, efforts to crash the prices from the sellers’ end get foiled by the buyers.
Ultimately, both parties bring the price to a pivot level. So, for example, when Bitcoin (BTC) opens and closes at $20,000 on a particular day even if its price seesawed between $25,000 and $15,000 throughout the given24-hour period.
So the $25,000 price level — or the intraday high — represents the Doji’s upper wick, and the $15,000 price level — the intraday low — represents the candlestick’s lower wick.
How does a Doji candle work?
Doji candlesticks have historically helped traders predict market bottoms and tops as a calm before the storm of sorts.
For example, a Doji candlestick that forms during an uptrend could signify bullish exhaustion, i.e., more buyers moving to the sellers’ side, typically leading to a trend reversal.
It is valid to note that the Doji pattern does not necessarily mean that there will always be a trend reversal. Instead, it shows indecision among traders about future trends.
Hence, it’s better to confirm the Doji candlestick signal with the help of additional technical indicators. For instance, a technical indicator like the relative strength index (RSI) and/or Bollinger Bands can give more weight to what the Doji pattern suggests.
Related: 5 More Bullish Candlestick Patterns Every Bitcoin Trader Must Know
Types of Doji patterns and how to trade them
Doji patterns can vary depending on the position and length of the shadow. These are the most popular variations:
Neutral Doji
The neutral Doji consists of a candlestick with an almost invisible body located in the middle of the candlestick, with the upper and lower wicks of similar lengths. This pattern appears when bullish and bearish sentiments are balanced.
Traders can combine the neutral Doji with momentum indicators like the RSI or Moving Average Convergence Divergence (MACD) to help identify potential market tops and bottoms.

Click Here to Read the Full Original Article at Cointelegraph.com News…