Cardano (ADA) price is in the process of painting its seventh red monthly candle in a row as the token fell to its lowest level since February 2021.
The trend saw ADA’s price rising nearly 800% to $3.16 between February 2021 and September 2021, followed by a complete wipeout of those gains entering October 2022. Amusingly, the entire price action took the shape of the “Burj Khalifa,” the world’s tallest skyscraper in Dubai.
Ada Khalifa pic.twitter.com/KE2SxTO3bN
— Trader_J (@Trader_Jibon) October 19, 2022
ADA price eyes 35% price crash
The ADA price correction began primarily in the wake of a similar downtrend across the cryptocurrency market, led by the Federal Reserve’s aggressive interest rate hikes to tame rising inflation.
Even an optimistic Cardano network upgrade dubbed Vasil was not enough to bring its buyers back to the market.
Notably, ADA’s price has dropped by nearly 20% since the Vasil hard fork nearly a month ago — an update aimed at improving its network’s scalability and smart contract capabilities.
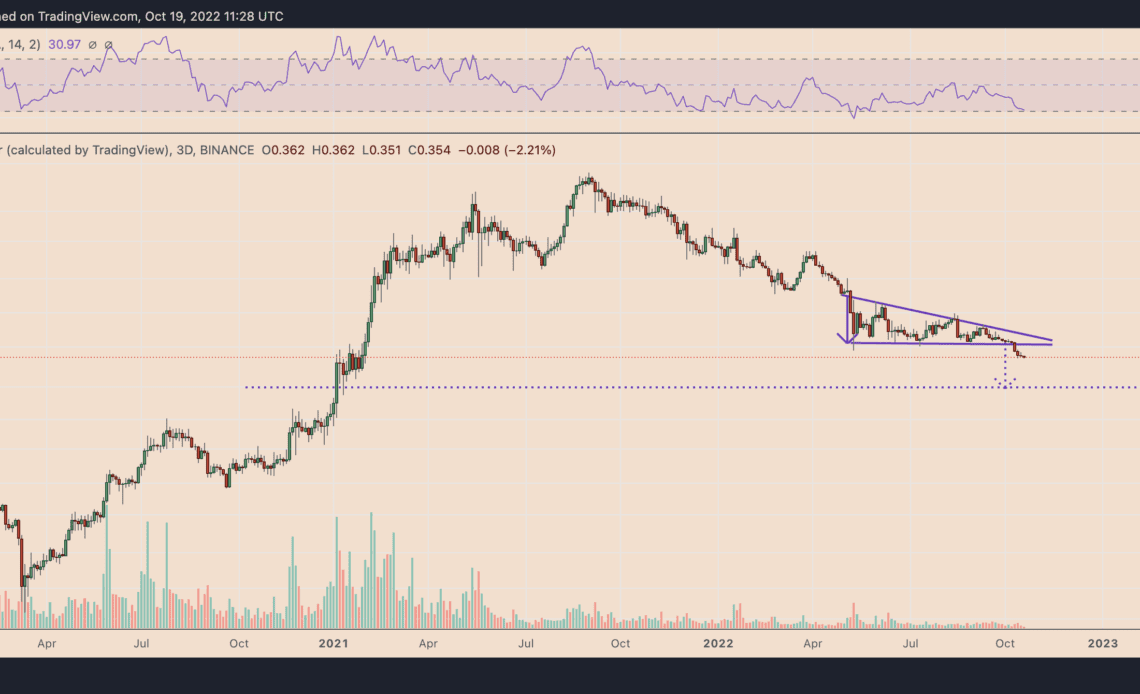
Moreover, the ADA/USD pair also broke below a key support level that may lead to another major crash ahead in Q4.
The said support level at around $0.42 constitutes a descending triangle, a continuation pattern. In other words, ADA’s potential to continue its prevailing downtrend becomes higher if it forms and breaks out of a descending triangle to the downside.
Meanwhile, as a rule of technical analysis, a descending triangle breakdown during a downtrend typically pushes the price lower to a level at length equal to the pattern’s maximum height. Therefore, ADA risks dropping toward $0.248, or by 35%, if the descending triangle breakdown plays out.
$ADA now losing the lights out level and going to the place where coins go when they die. Prob got a -50% in it from that breakdown level imo
And I’m by no means picking on it. I posted charts for almost several alts like this including $SOL and $ETH in Dec-Jan pic.twitter.com/Of0TNZfXKK
— Pentoshi (@Pentosh1) October 19, 2022
Conversely, a retest followed by a close above the triangle’s lower trendline as resistance raises ADA’s possibility to invalidate the bearish outlook. In doing so, it could trigger a descending channel setup forming simultaneously with the ascending triangle, as shown below.
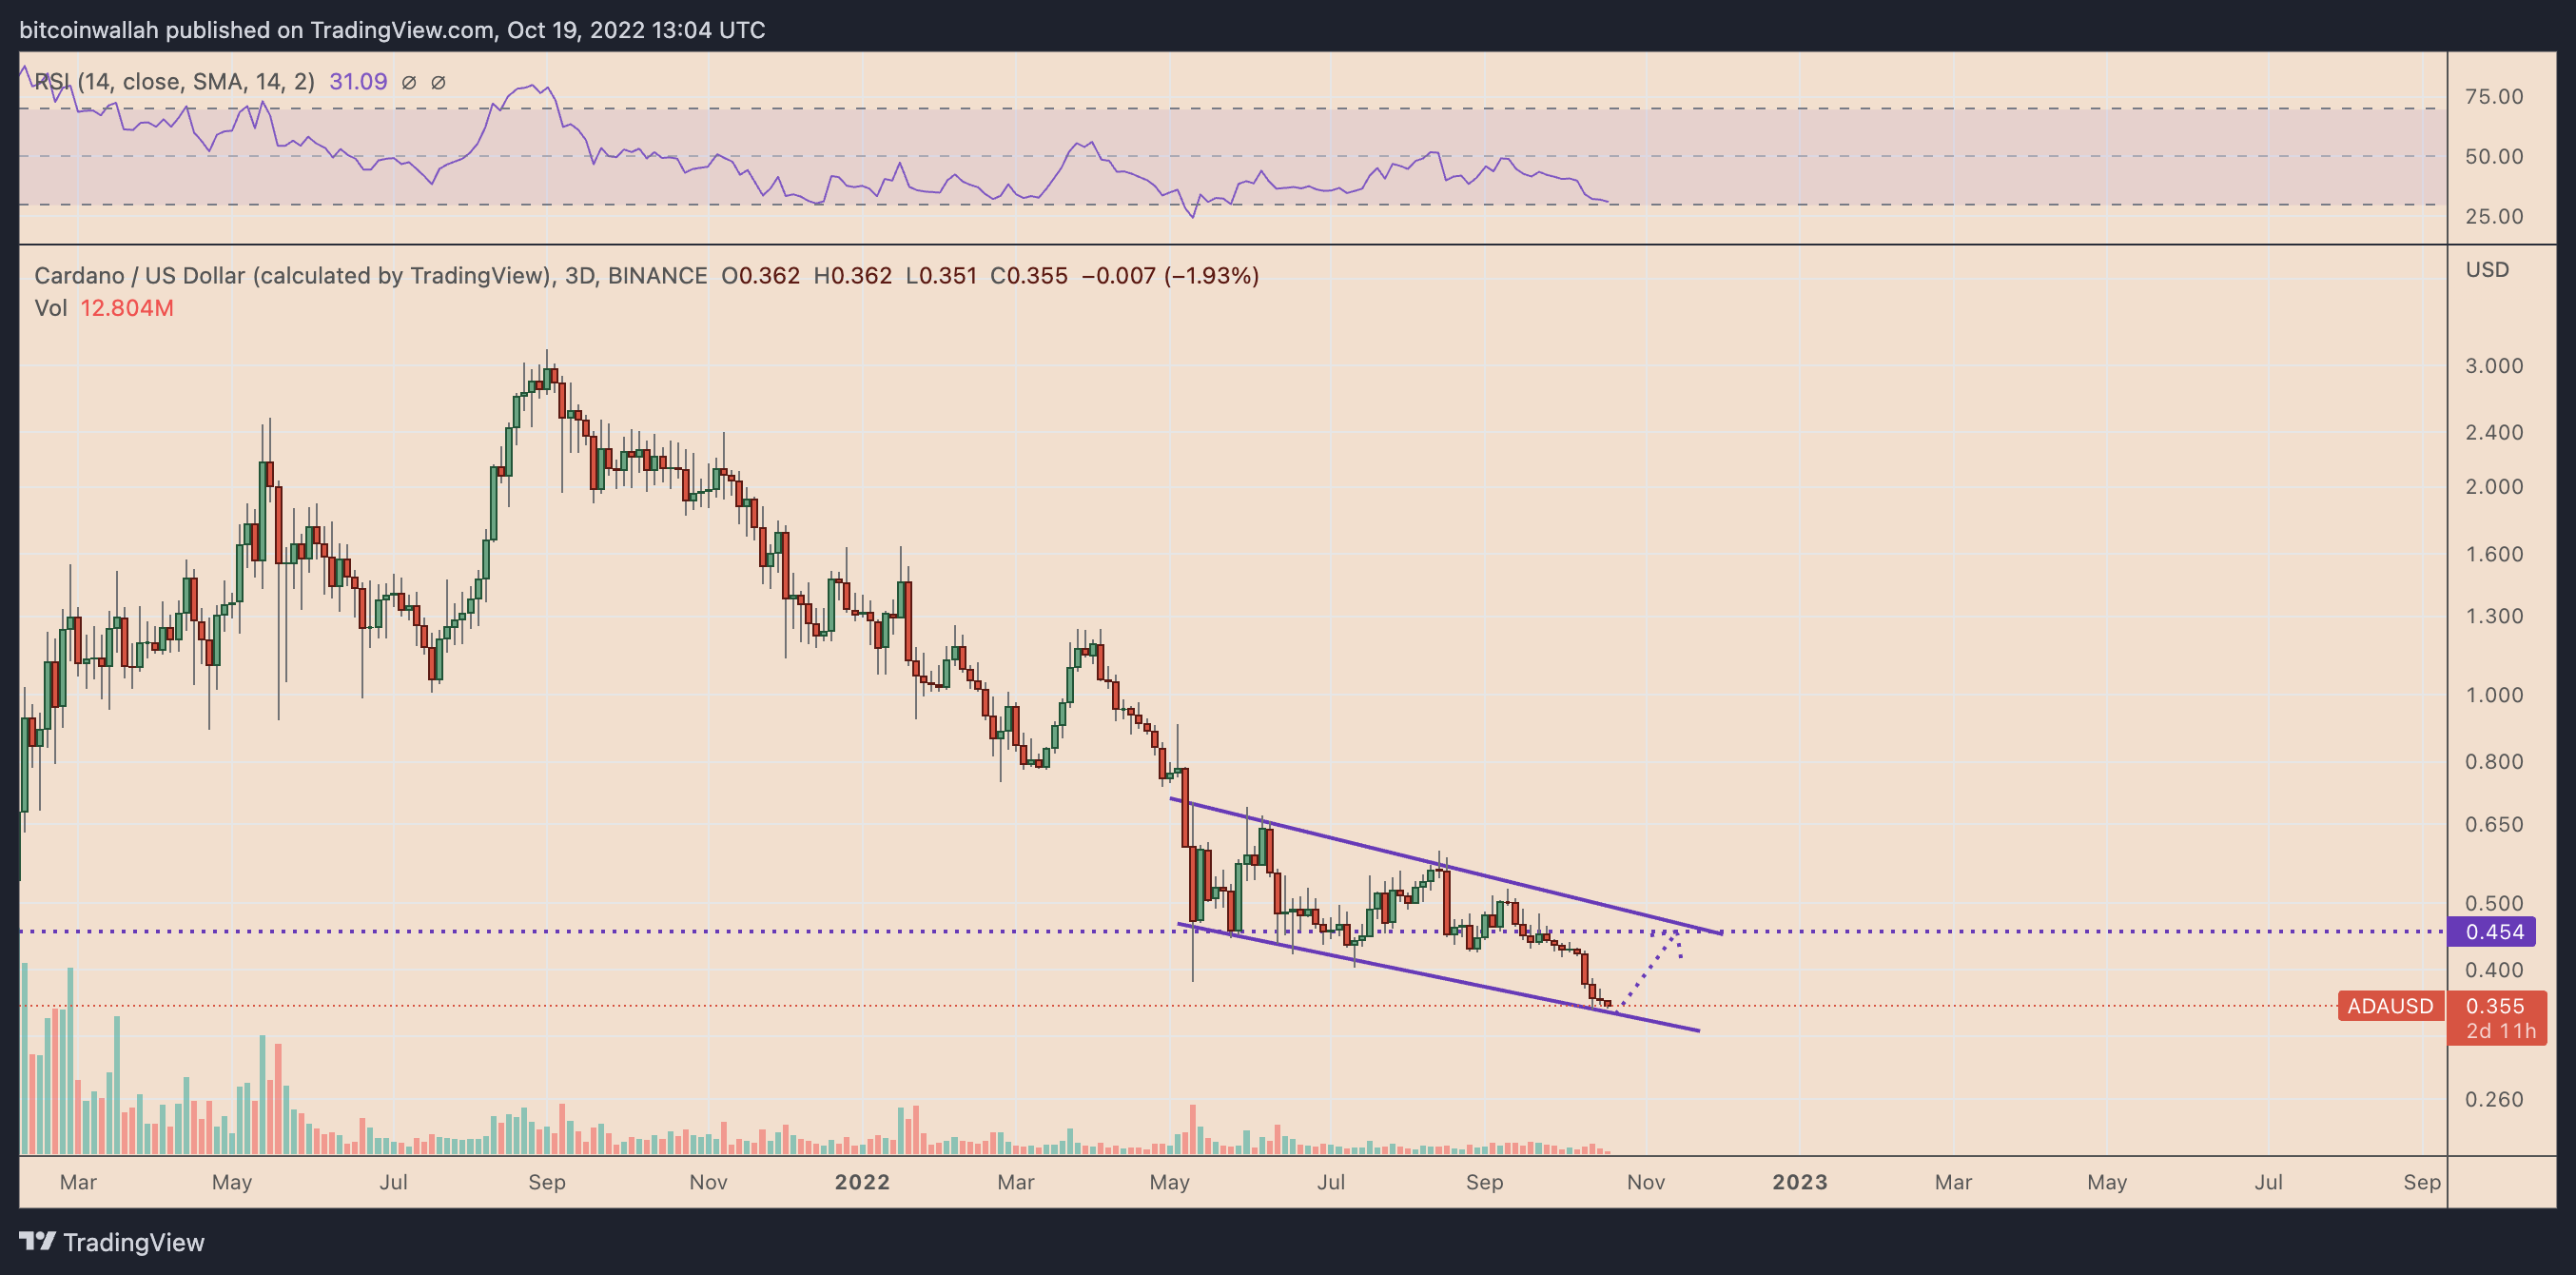
The descending channel…
Click Here to Read the Full Original Article at Cointelegraph.com News…