Bitcoin (BTC) has been in a rut, and BTC’s price is likely to stay in its current downtrend. But like I mentioned last week, when nobody is talking about Bitcoin, that’s usually the best time to be buying Bitcoin.
In the last week, the price took another tumble, dropping below $19,000 on Sept. 6, and currently, BTC bulls are struggling to flip $19,000–$20,000 back to support. Just this week, Federal Reserve Chairman Jerome Powell reiterated the Fed’s dedication to doing literally whatever it takes to combat inflation “until the job is done,” and market analysts have increased their interest rate hike predictions from 0.50 basis points to 0.75.
Basically, interest rate hikes and quantitative tightening are meant to crush consumer demand, which in turn, eventually leads to a decrease in the cost of goods and services, but we’re not there yet. Additional rate hikes, plus QT are likely to push equities markets lower, and given their high correlation to Bitcoin price, further downside for BTC is the most likely outcome.
So, yeah, there’s not a strong investment thesis for Bitcoin right now from the perspective of price action and short-term gains. But what about those who have a longer investment horizon?
Let’s quickly review three charts that suggest investors should be buying Bitcoin.
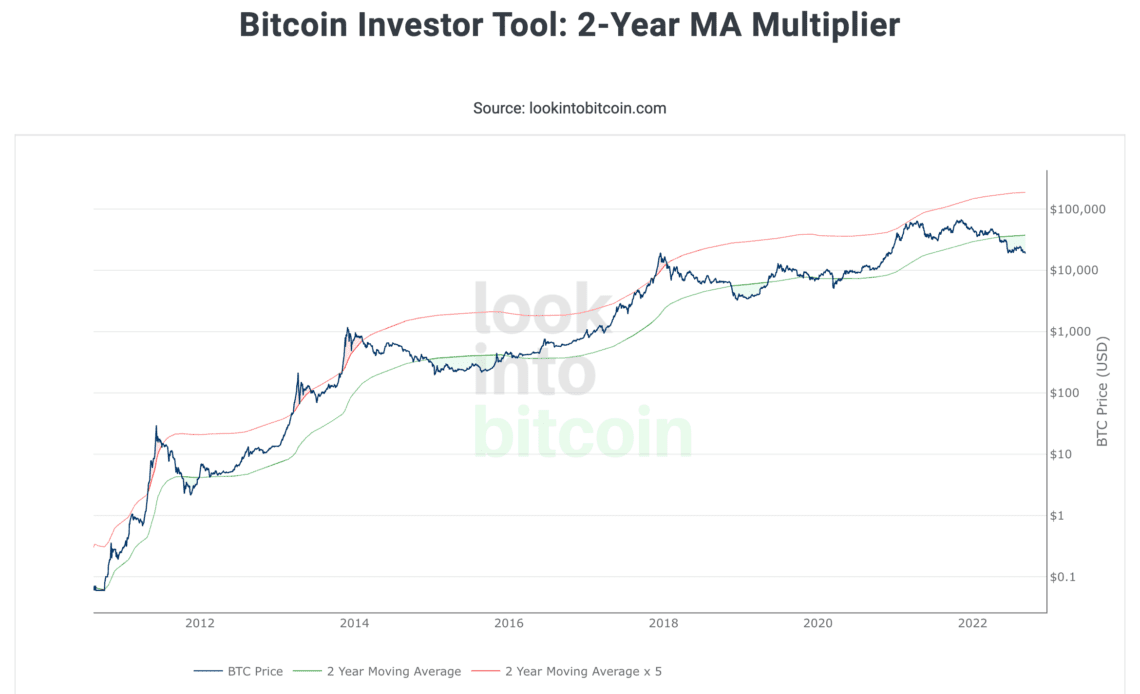
Bitcoin investor tool: Two-year MA multiplier
Bitcoin’s price is currently 72% down from its all-time high at $69,000. In the previous bear markets, BTC’s price saw a 55% correction (July 21), a 71% drop by March 2020, and an 84% correction in December 2018. While brutal to endure, the current 72% correction is not outside of the norm when compared to previous drawdowns from all-time highs.
Comparing this drawdown data against the two-year MA multiplier, one will notice that the price dropped below the two-year moving average, carved out a trough, and then consolidated for multiple months before resuming the 12-year-long uptrend.
These areas are the “shaded” zones below the green two-year moving average. Zooming in on the right side of the chart, we can see that price is again below the two-year moving average, and while there is no sign of a “trough” being dug, if historicals are to be relied upon, the price is currently in what could be described as a consolidation zone.
The golden ratio multiplier
Another interesting moving average and Fibonacci sequence-based indicator that…
Click Here to Read the Full Original Article at Cointelegraph.com News…