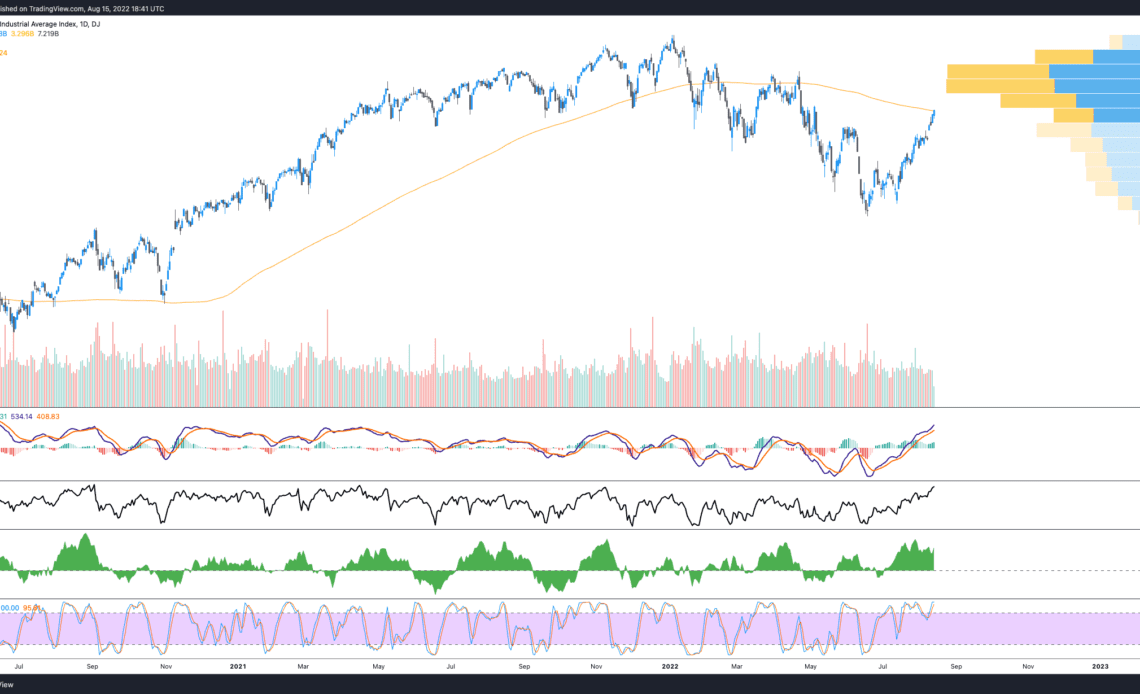
On August 15, Bitcoin (BTC) price and the wider market corrected while the S&P 500 and DOW looked to build on four-straight weeks of robust gains. Data from TradingView and CNBC show the Dow pushing through its 200-day moving average, a first since April 21 and perhaps a sign for bulls that the market has bottomed.
While equities markets have been strikingly bullish in the face of high inflation and a steady schedule of interest rate hikes, a number of traders fear that the current 32 day uptrend in the DOW and S&P 500 could be a bear market rally.
This week’s (August 17) release of minutes from the Federal Open Markets Committee (FOMC) should give more context to the Federal Reserve’s current view of the health of the U.S. economy and perhaps shed light on the size of the next interest rate hike.
For the past month, overly bullish crypto traders on Twitter have also been touting a narrative that emphasizes Bitcoin, Ether (ETH) and altcoins selling off prior to FOMC meetings and then rallying afterward if the set rate aligns with investors’ projected figure.
Somehow, this short-term dynamic also contributes to investors’ belief that the Fed will “pivot” away from its monetary policy of interest hikes and quantitative tightening after “inflation peaks.” This may be a somewhat profitable trade for savvy day-traders, but it’s important to note that inflation is currently at 8.5% and the Fed’s target is 2%, which is quite aways to go.
Ultimately, Bitcoin price maintains a high correlation to the S&P 500 so investors would be wise to avoid tunnel vision-like narratives that align with their bias and keep an eye on the performance of equities markets.
Bitcoin sells-off at a multi-month trendline resistance
Over the weekend Bitcoin made a strong move at a multi-month descending trendline and broke through the $24,000 level, following a path which many traders anticipated would trigger an upside move and VPVR gap fill to the $28,000 to $29,000 level.
$BTC really looked like it was going to go last night – and now we have 2x outside brewing pic.twitter.com/gkyLodiXi6
— Cheds (@BigCheds) August 15, 2022
Trader Cheds said “BTC really looked like it was going to go last night” but the selling at resistance created an “outside bar” where “the prior trend was challenged” and according to Cheds, this is a sign that “the trend may be stalling and be on the look out for signs of…
Click Here to Read the Full Original Article at Cointelegraph.com News…