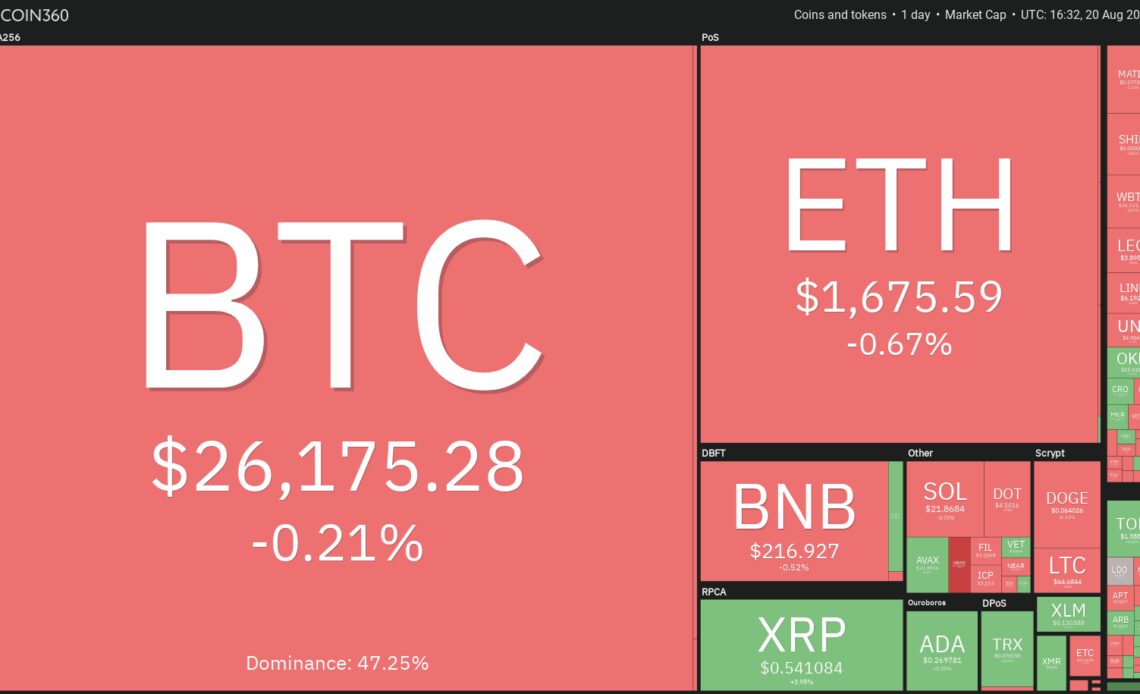
Trader sentiment has turned bearish following Bitcoin’s (BTC) 11% slump this week. Although Bitcoin is taking support near $25,000, several analysts are factoring in another leg down toward the crucial $20,000 level.
The weakness is not limited to the cryptocurrency markets alone. United States equities markets also witnessed a losing week. The S&P 500 Index fell 2.1% and the Nasdaq Composite dropped about 2.6%, both indices recording a three-week losing streak. This suggests that traders are in a risk-off mode in the near term.
The fall in Bitcoin dragged several altcoins lower, indicating a broad-based sell-off. However, amongst the sea of red, there are a few altcoins that have stood out either by bouncing off strong support levels or by continuing their up-move.
Let’s study the charts of the top-5 cryptocurrencies that may buck the negative trend and stay positive over the next few days.
Bitcoin price analysis
Bitcoin has been range-bound between $24,800 and $31,000 for the past several days. After failing to sustain above the resistance, the price has dipped near the support of the range.
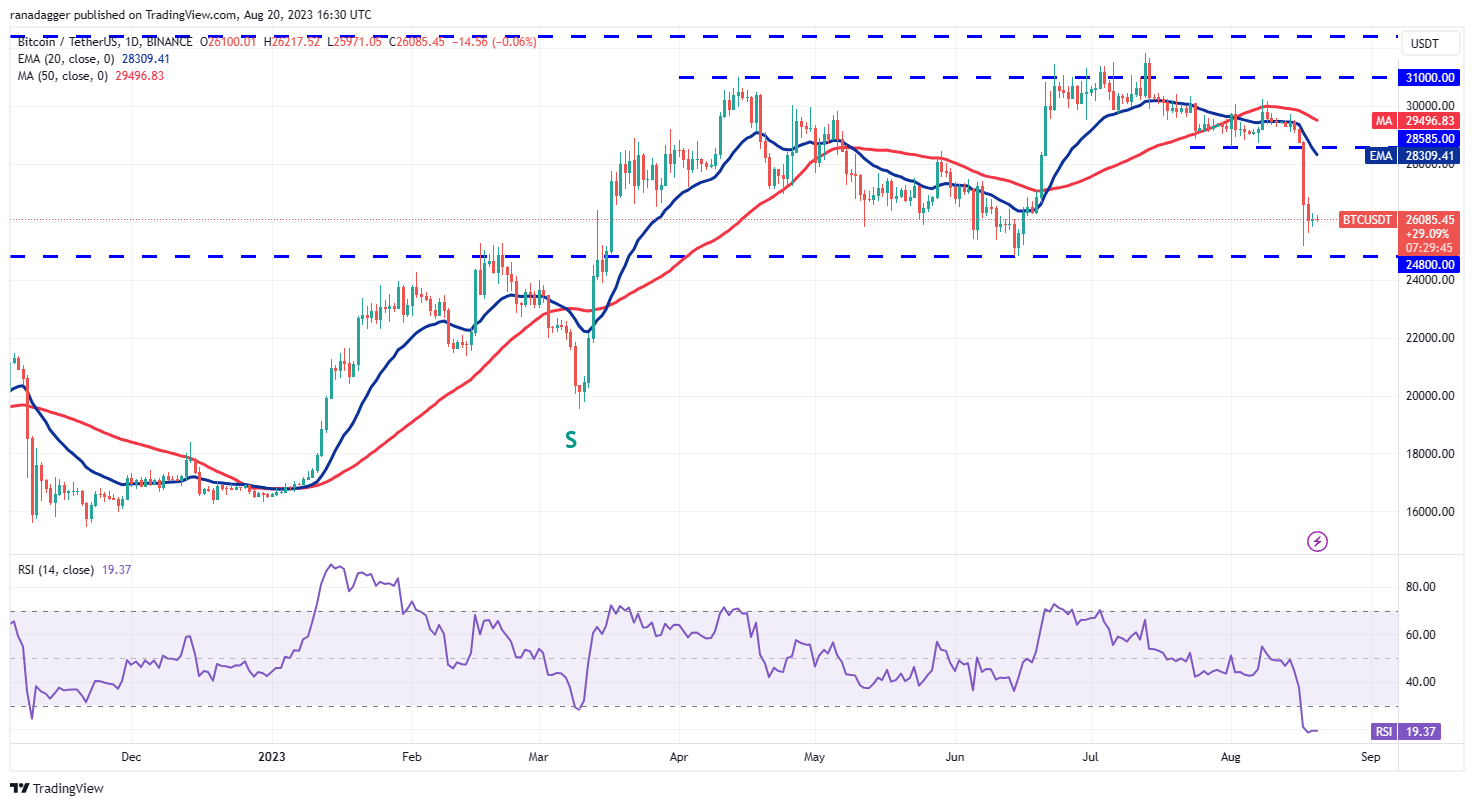
The fall of the past few days has pulled the relative strength index (RSI) into the oversold territory, indicating that a recovery may be around the corner. If the price rises from the current level, it could reach the 20-day exponential moving average ($28,309). The bears are likely to sell the rallies to this level.
If the price turns down from the 20-day EMA, the BTC/USDT pair may again drop to the crucial support at $24,800. If this support gives way, the pair may start a descent to $20,000.
On the upside, a break and close above the 20-day EMA will indicate that the pair may extend its stay inside the range for a few more days. The bulls will have to push and sustain the price above $31,000 to start a new up-move but that looks a little far-fetched at the moment.
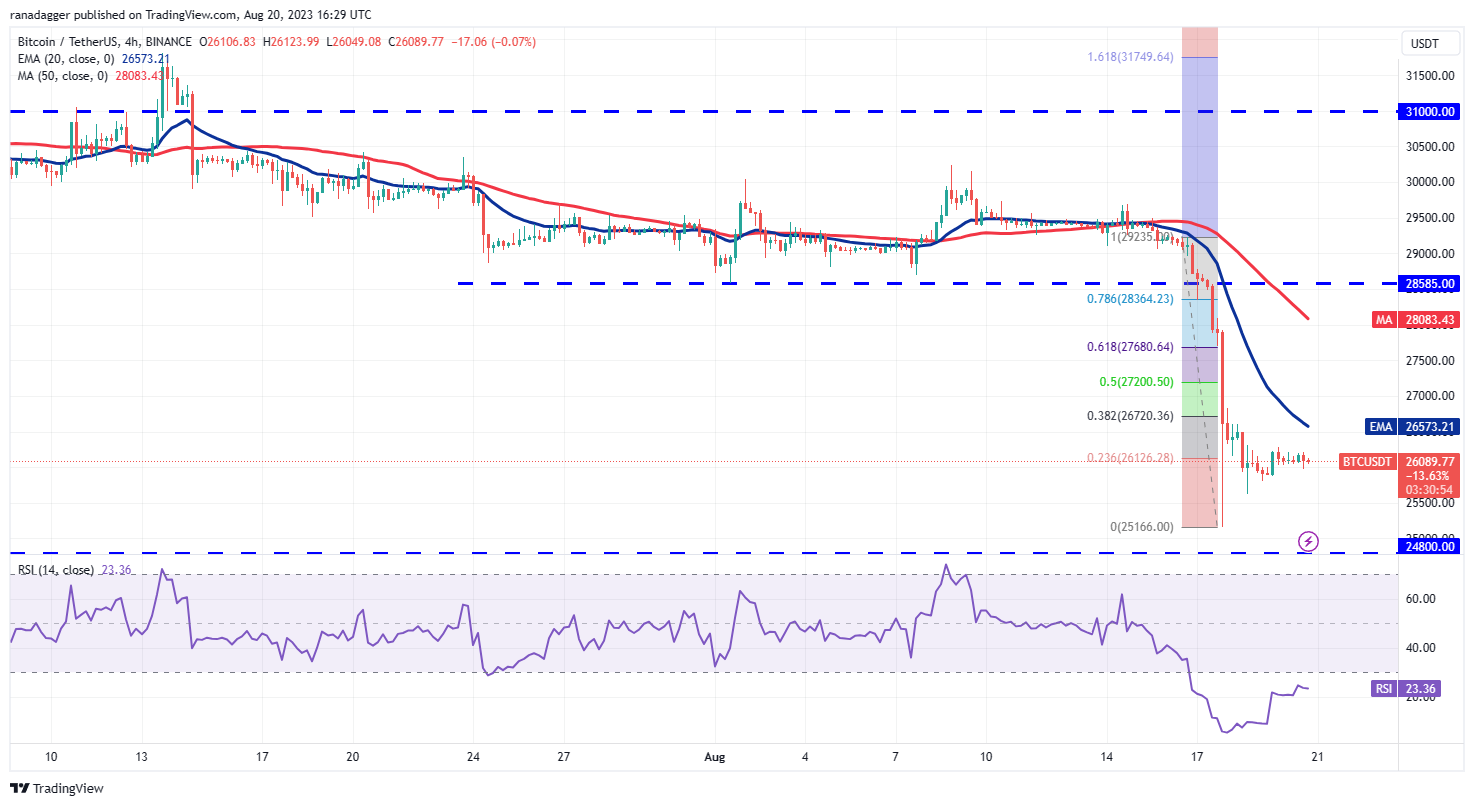
Both moving averages are sloping down and the RSI is in the oversold territory on the 4-hour chart, indicating that bears are in command. If the price turns down from the 20-EMA, the pair may retest the support zone between $25,166 and $24,800.
Conversely, a break and close above the 20-EMA could signal that the bears may be losing their grip. That could start a rally to the 50% Fibonacci retracement level of $27,200 and then to the 61.8% retracement level of $27,680.
Hedera…
Click Here to Read the Full Original Article at Cointelegraph.com News…