Bitcoin’s (BTC) volatility has shrunk further this week and it is on track to form an inside-bar pattern on the weekly chart. Although the bulls are finding it difficult to clear the overhead hurdle in the $30,000 to $31,000 zone, a positive sign is that they have not ceded ground to the bears.
It is not only cryptocurrencies, even the S&P 500 Index has been oscillating inside a range for the past few days. This indicates that markets are awaiting a trigger to start the next directional move.
While the short-term price action is uncertain, analysts are getting bullish for the long term. Trader Titan of Crypto highlighted a potential signal on the Bollinger Bands monthly chart, which projects a rally to $63,500 in about a year.
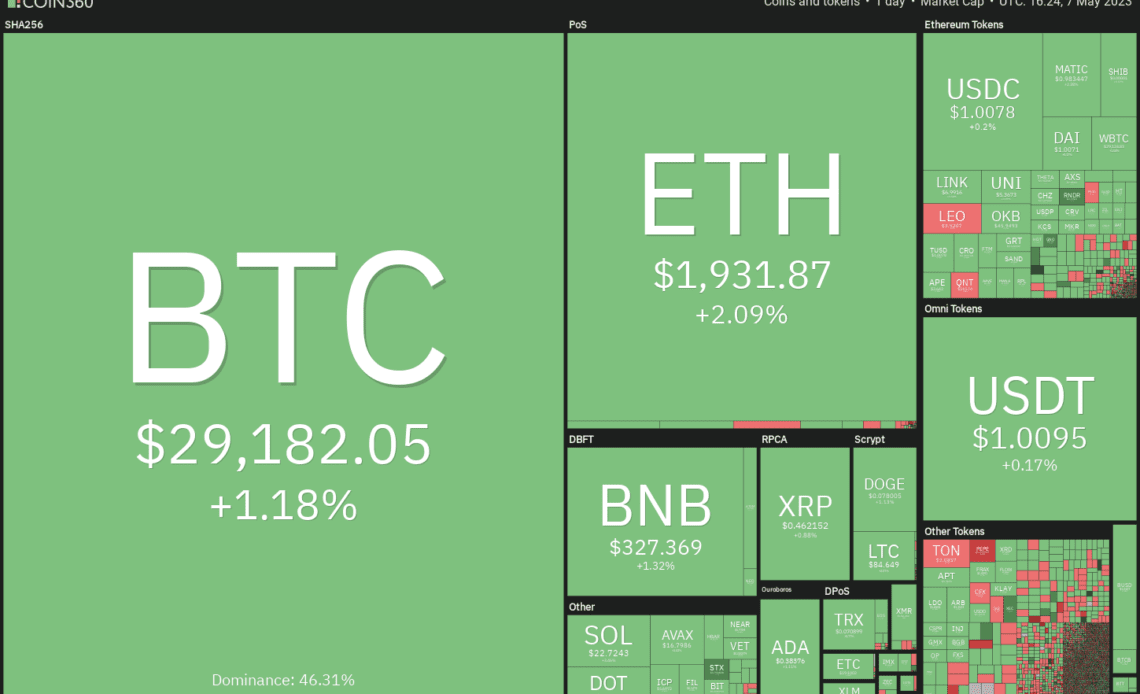
While most major cryptocurrencies gave up some ground over the past week there are still some pockets of strength. Let’s analyze the charts of five cryptocurrencies that may turn up in the short term.
Bitcoin price analysis
Bitcoin turned down sharply from the resistance line of the symmetrical triangle pattern on May 6, indicating that the bears are not willing to let the bulls through. A minor positive is that the bulls have been buying the dips to the support line of the triangle as seen from the long tail on the day’s candlestick.
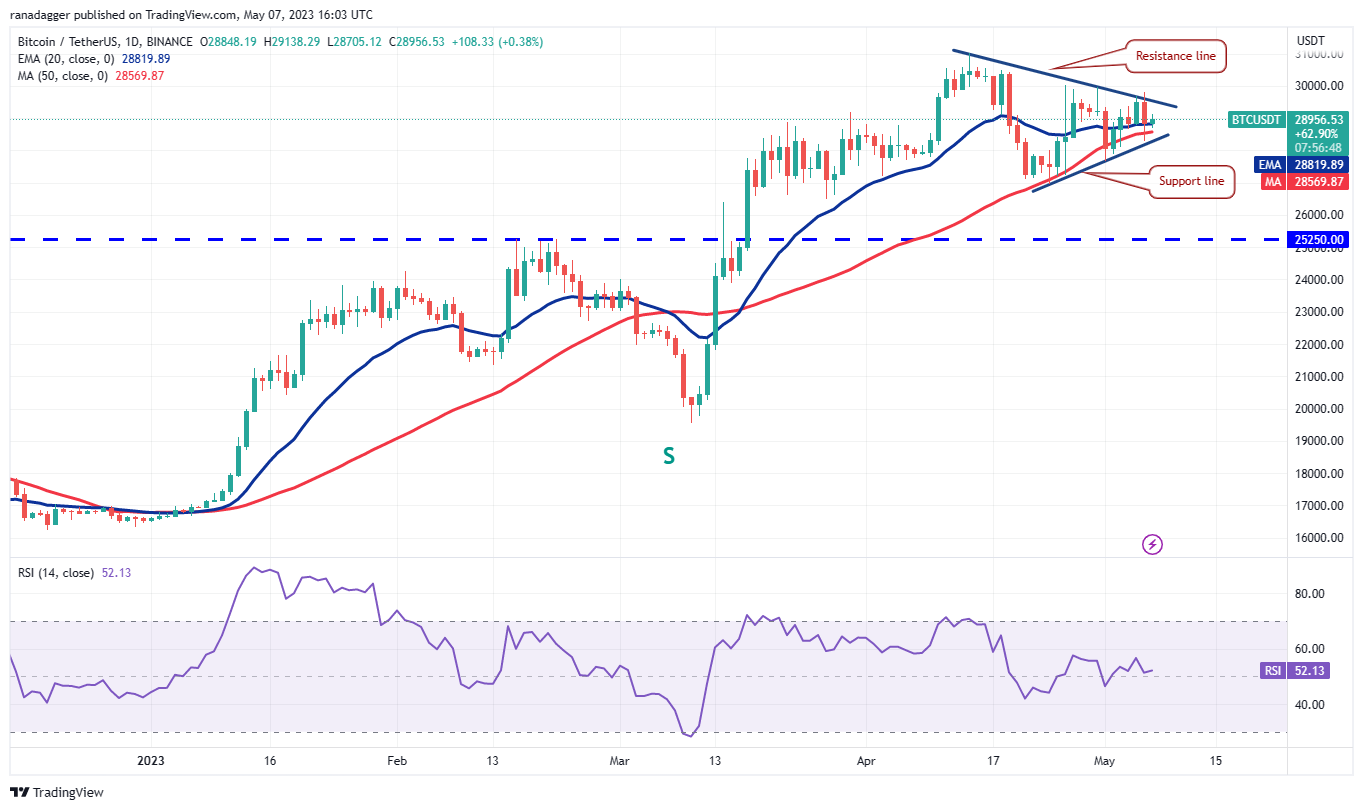
The flattish 20-day exponential moving average ($28,819) and the relative strength index (RSI) near the midpoint do not signal a clear advantage either to the bulls or the bears.
If the price breaks below the triangle, it will suggest that bears are trying to seize control. The BTC/USDT pair may first fall to $26,942 and then to $25,250.
On the other hand, a break and close above the triangle will suggest that the bulls have absorbed the supply. That may start a rally to $32,400 where the bears are again expected to mount a strong defense.
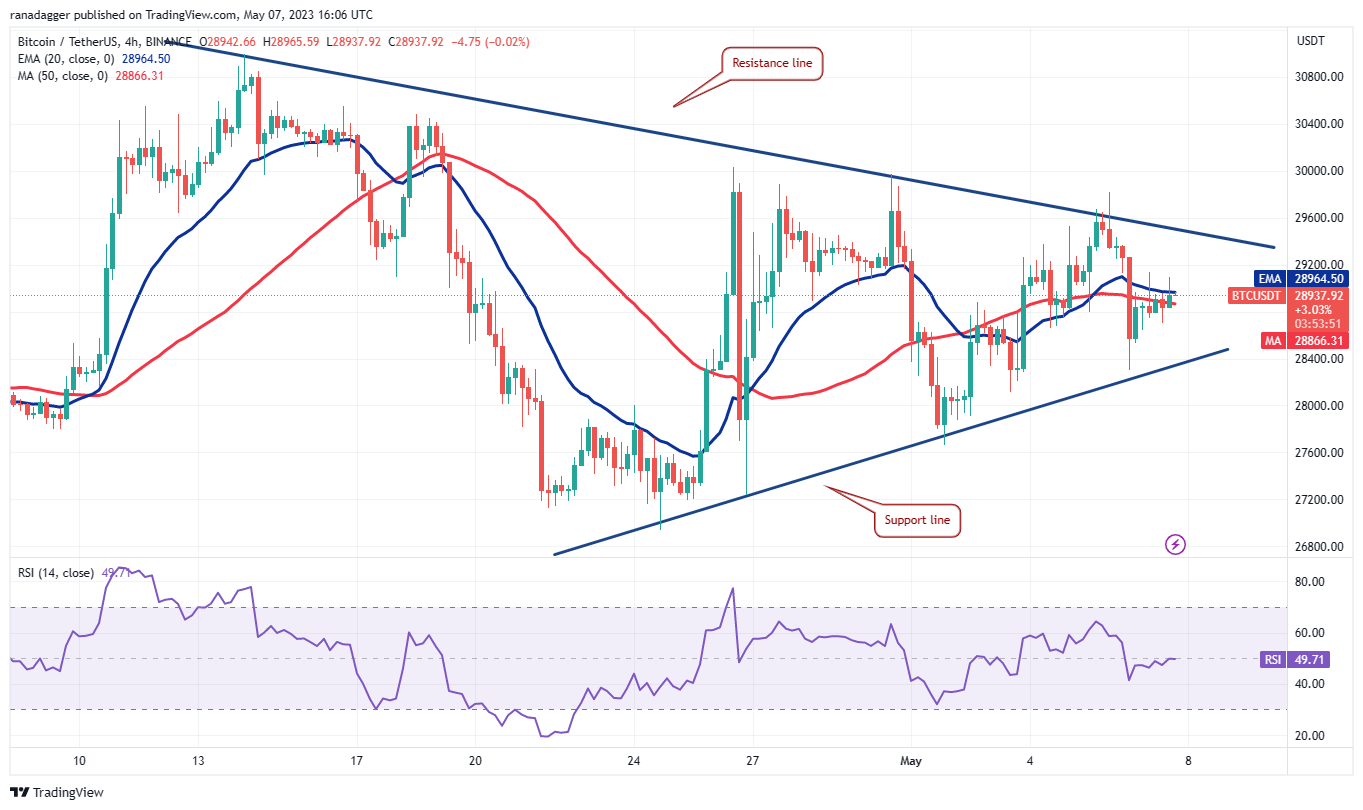
Buyers nudged the price above the triangle but the long wick on the candlestick shows that the breakout turned out to be a bull trap in the near term. BTC price turned down sharply and plunged to the support line of the triangle.
The bounce off this level has reached the moving averages, which is a key short-term level to watch out for. If Bitcoin’s price turns down from the current level, it will raise the chances of a break below the support line.
Contrarily, if buyers kick the price above the moving averages, the pair may rise to the…
Click Here to Read the Full Original Article at Cointelegraph.com News…