The long weekend has not produced any fireworks in Bitcoin (BTC) price, which continues to trade inside an ever-narrowing range. Bitcoin is on track to form a third consecutive Doji candlestick pattern on the weekly chart. This suggests that the Bitcoin bulls and the bears are not clear about the next directional move.
It is not only Bitcoin that is stuck inside a range. On April 7, Jurrien Timmer, director of global macro at asset manager Fidelity Investments, tweeted that the S&P 500 Index had been stuck inside a range for the past nine months and a breakout was due “sooner or later.”
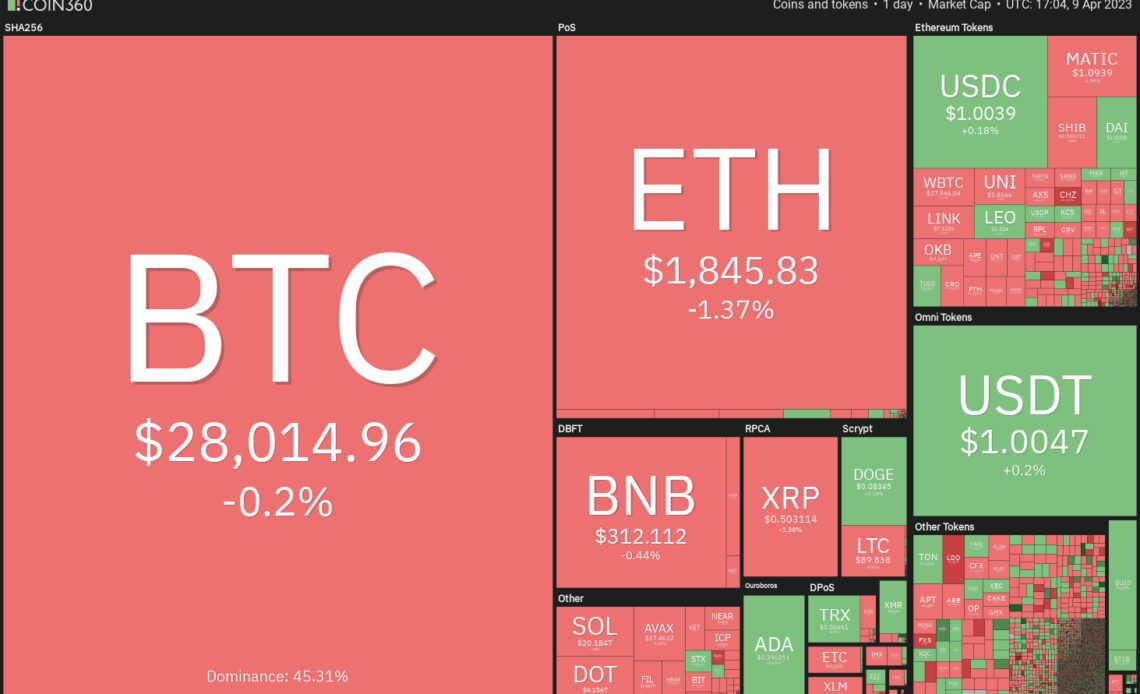
Bitcoin’s failure to break above the $30,000 level has attracted profit-booking in several altcoins but a few have witnessed shallow pullbacks. This indicates that traders are holding on to their positions expecting a move higher.
Let’s study the charts of select altcoins that may turn up and start an uptrend if Bitcoin breaks out to the upside. What are the resistance levels above which these five cryptocurrencies turn bullish?
Bitcoin price analysis
Bitcoin has been trading inside a tight range for the past two days, indicating indecision among the bulls and the bears. Usually, tight ranges are followed by an expansion in volatility.
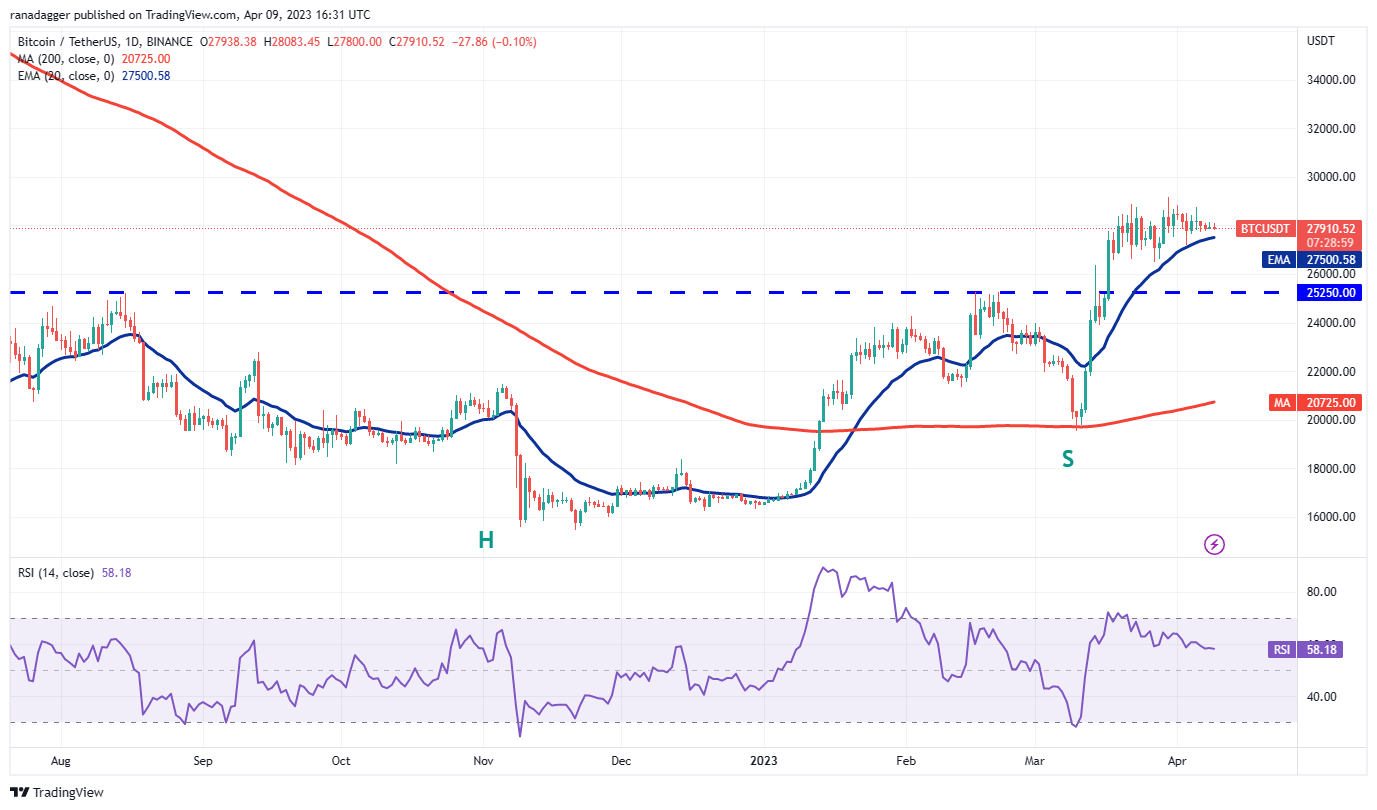
The 20-day exponential moving average ($27,500) is flattening out and the relative strength index (RSI) has gradually been slipping toward the center. This suggests a balance between supply and demand.
If the price tumbles below the 20-day EMA, several short-term stop losses may be triggered and the BTC/USDT pair may dive to the breakout level of $25,250.
Conversely, if the price rebounds off the 20-day EMA with strength, it will suggest that the sentiment remains positive and traders are buying the dips. A rally above $29,200 could enhance the prospects of a rally to $30,000 and subsequently to $32,500.
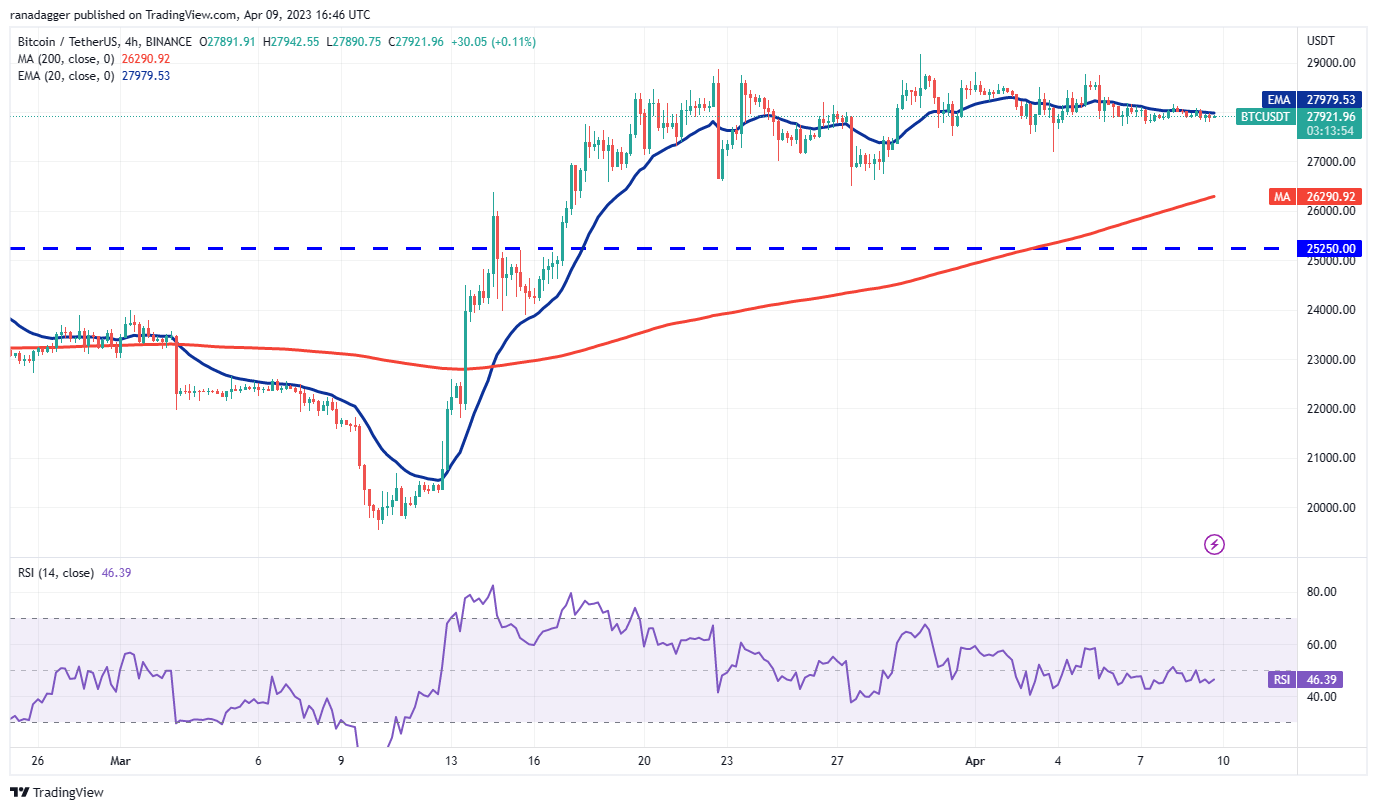
The 20-EMA is flattening out on the 4-hour chart and the RSI is just below the midpoint. This does not give a clear advantage either to the bulls or the bears. This uncertainty is unlikely to continue for long and a directional move could soon start. However, it is difficult to predict the direction of the breakout.
Therefore, it is better to wait for the breakout to happen before establishing directional bets. The important level to watch on the upside is $29,200 and on the downside is $26,500. A breach of…
Click Here to Read the Full Original Article at Cointelegraph.com News…