Bitcoin (BTC) and altcoins are tracking the United States equities markets higher on Aug. 3 as traders buy the dip.
Smaller investors seem to be making the most of the bear market in Bitcoin as the number of wholecoiners has soared by 40,000 since the sharp fall in June. In comparison, wallet addresses with more than 1,000 Bitcoin have declined by 113 since May.
Some analysts believe that Bitcoin has not yet formed a macro bottom, however. Trading firm QCP Capital expects Bitcoin to gradually rise for most of the third quarter amid high volatility.
They believe Bitcoin’s rally could hit a roof around $28,700. For the long-term, the firm did not rule out a final capitulation in Bitcoin to around $10,000, which may mark a bottom for the bear market.
Nevertheless, Bitcoin miners seem to be in an upbeat mode as they increased their Bitcoin holdings in July following the capitulation in June. According to data from on-chain analytics firm CryptoQuant, Bitcoin held by the miners hit the highest levels since.
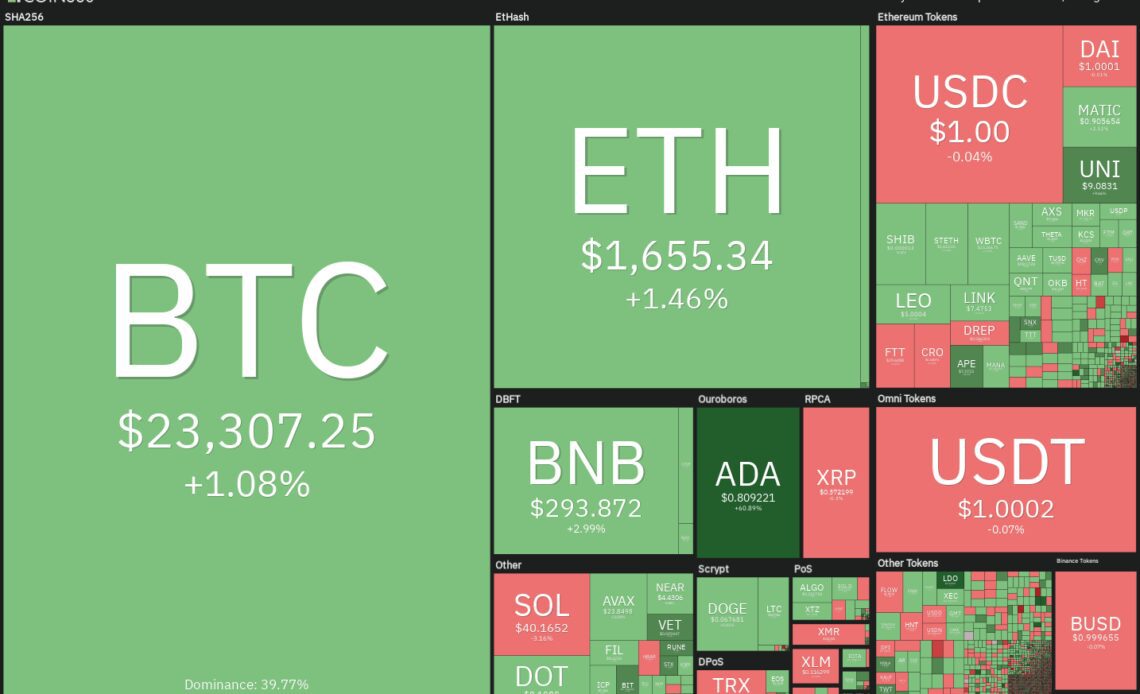
Could Bitcoin and altcoins resume their up-move or will the recovery falter at higher levels? Let’s study the charts of the top-10 cryptocurrencies to find out.
BTC/USDT
Bitcoin dropped to the 20-day exponential moving average (EMA) ($22,632) on Aug. 2, which is acting as strong support. The gradually up-sloping 20-day EMA and the relative strength index (RSI) in the positive territory suggest that bulls have a slight edge.
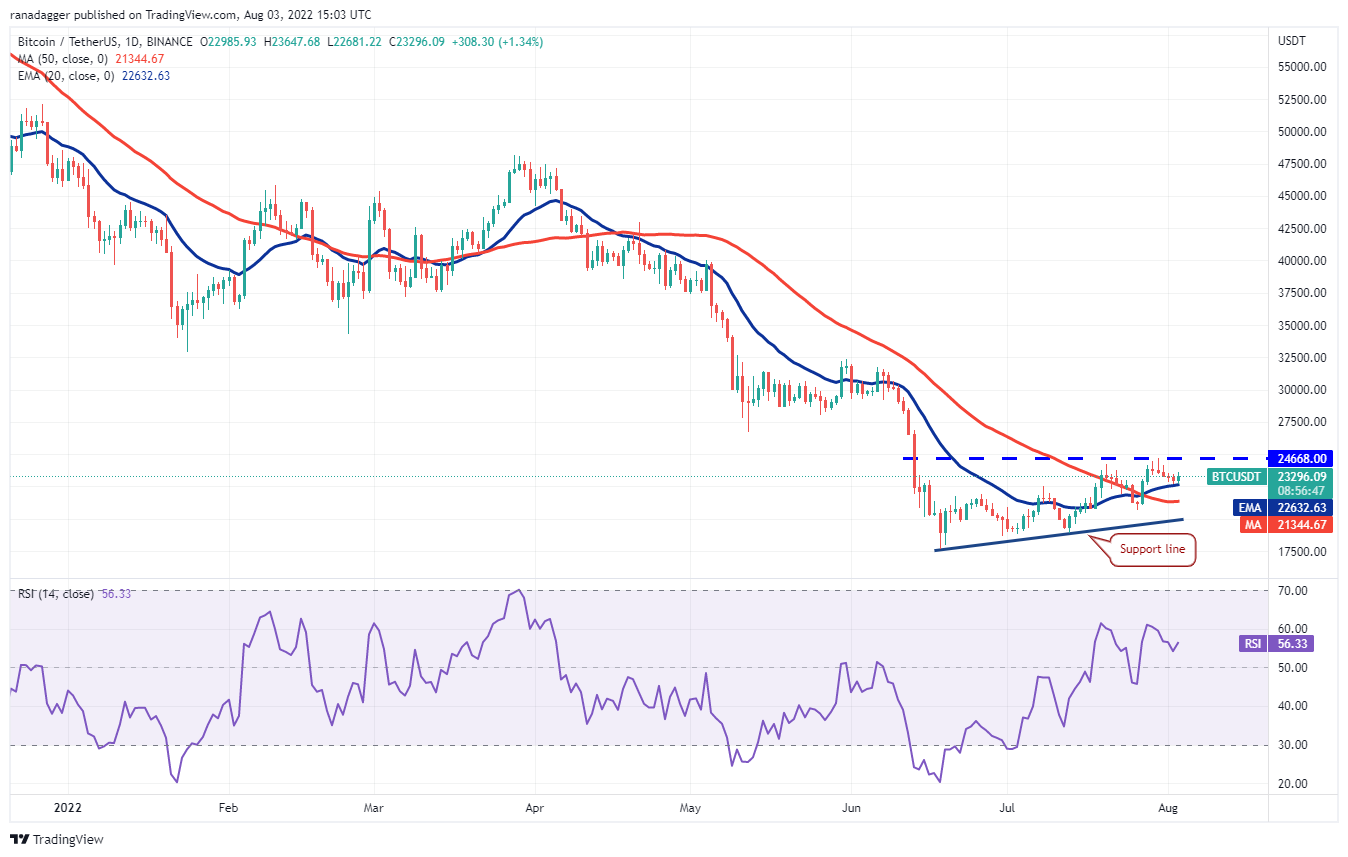
The buyers will now attempt to push the price above the overhead resistance at $24,668. If they succeed, the BTC/USDT pair could rally to $28,000 where the bears may mount a stiff resistance. If bulls clear this hurdle, the rally could extend to $32,000.
Contrary to this assumption, if the price turns down from the current level or the overhead resistance, it will suggest that higher levels continue to attract selling from the bears. A break and close below the 20-day EMA could sink the pair to the 50-day simple moving average (SMA) ($21,344) and then to the support line.
ETH/USDT
Ether (ETH) turned down and dropped to the 20-day EMA ($1,545) on Aug. 2 but the long tail on the candlestick suggests that the bulls aggressively purchased the dip.
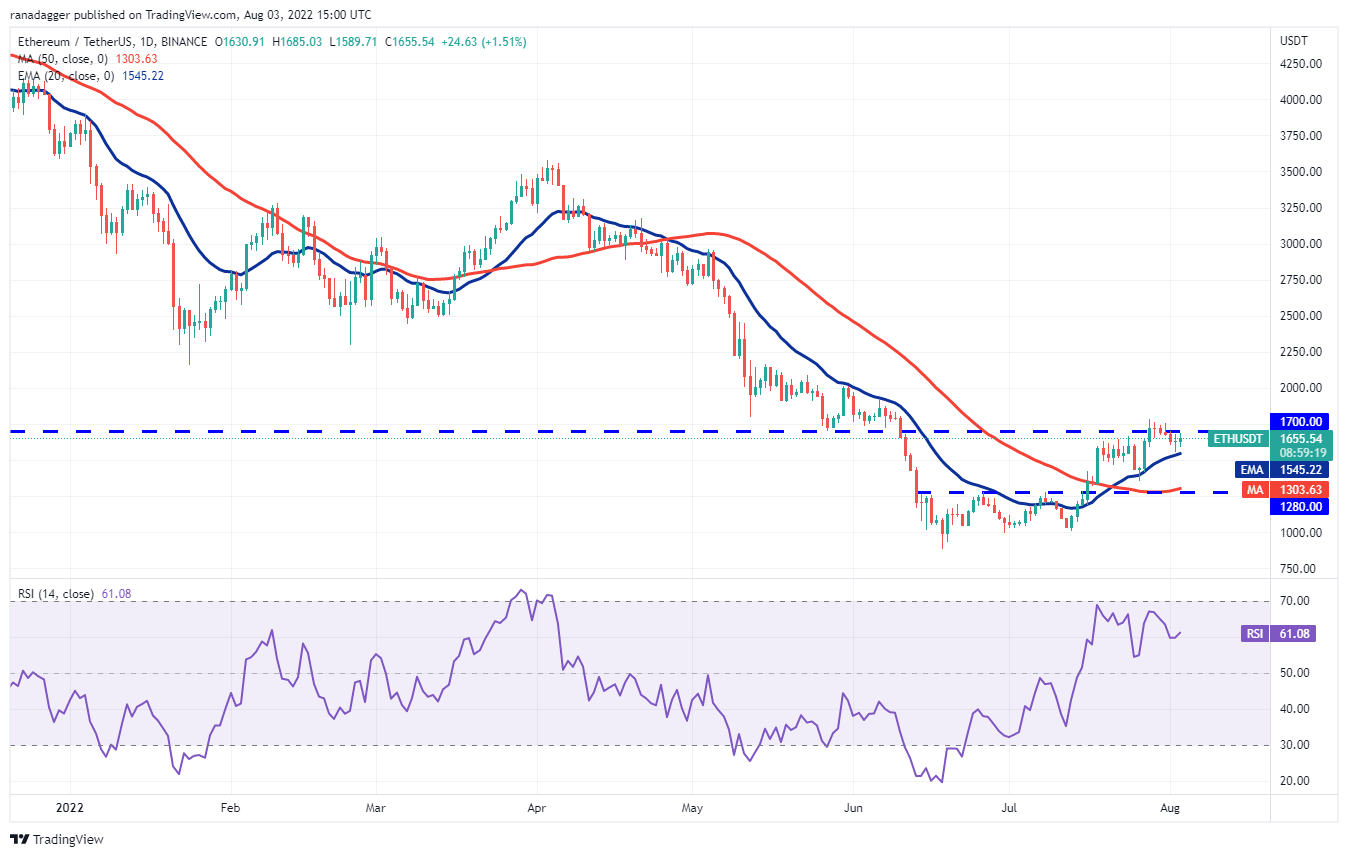
The bulls will once again attempt to clear the overhead resistance zone between $1,700 and $1,785. If they succeed, it will indicate a potential trend change. The…
Click Here to Read the Full Original Article at Cointelegraph.com News…