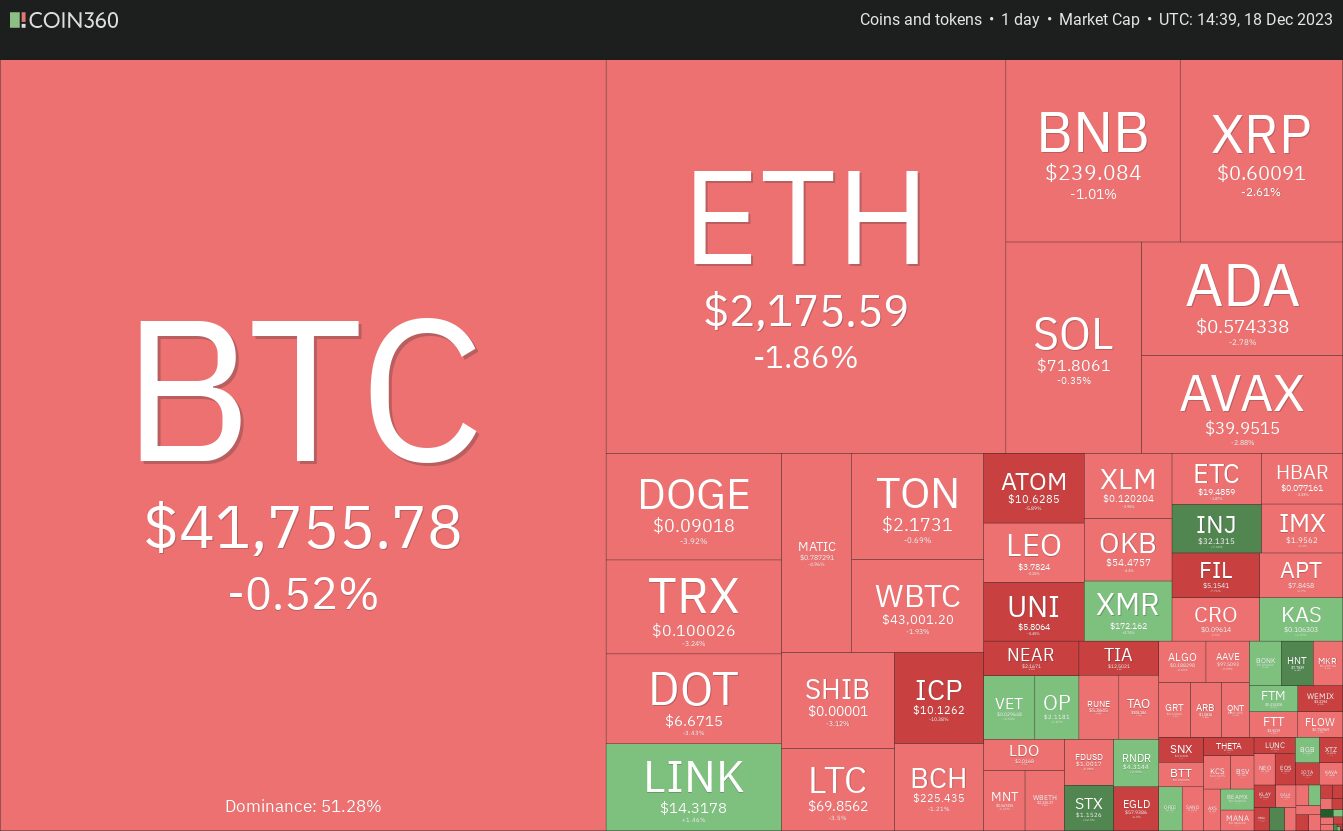
The S&P 500 Index (SPX) rose 2.49% last week, extending its string of weekly gains to seven weeks, the longest such winning streak since 2017. However, Bitcoin (BTC) could not maintain its momentum and succumbed to profit-booking by the bulls. Trading resource Material Indicators said in a X (formerly Twitter) post that “ year-end profit taking and tax loss harvesting” will prevail in the short term.
However, a crash is unlikely because several analysts expect the United States Securities and Exchange Commission to approve one or more spot Bitcoin exchange-traded fund applications in January. If that happens, it could prove to be a game-changer for the sector.

VanEck CEO Jan van Eck said in an interview with CNBC that Bitcoin is likely to hit a new all-time high in the next 12 months. He expects Bitcoin to become an accompaniment to gold.
What are the important levels that could arrest the fall in Bitcoin and altcoins? Let’s analyze the charts to find out.
S&P 500 Index price analysis
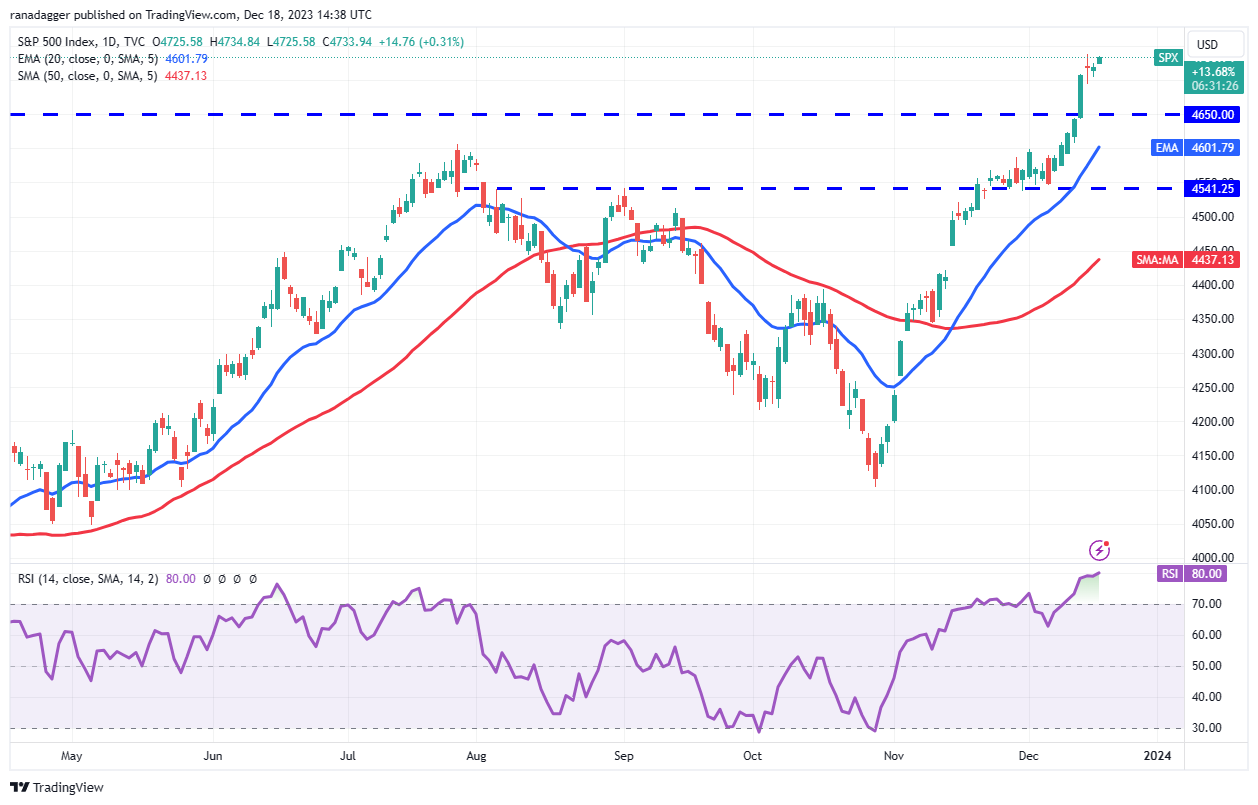
The S&P 500 Index witnessed a strong bull move in the past few days, which carried the price above the overhead resistance of 4,650 on Dec. 13.

The sharp rally has pushed the relative strength index (RSI) deep into the overbought territory, indicating that the markets are overheated in the short term. That may start a correction or a consolidation over the next few days. The strong support on the downside is at the breakout level of 4,650 and then the 20-day exponential moving average (4,601).
If the price continues higher and breaks above 4,740, the index may extend the uptrend to 4,819. This level is again likely to witness a tough battle between the bulls and the bears, but if the buyers prevail, the rally could reach the psychological level of 5,000.
U.S. dollar Index price analysis
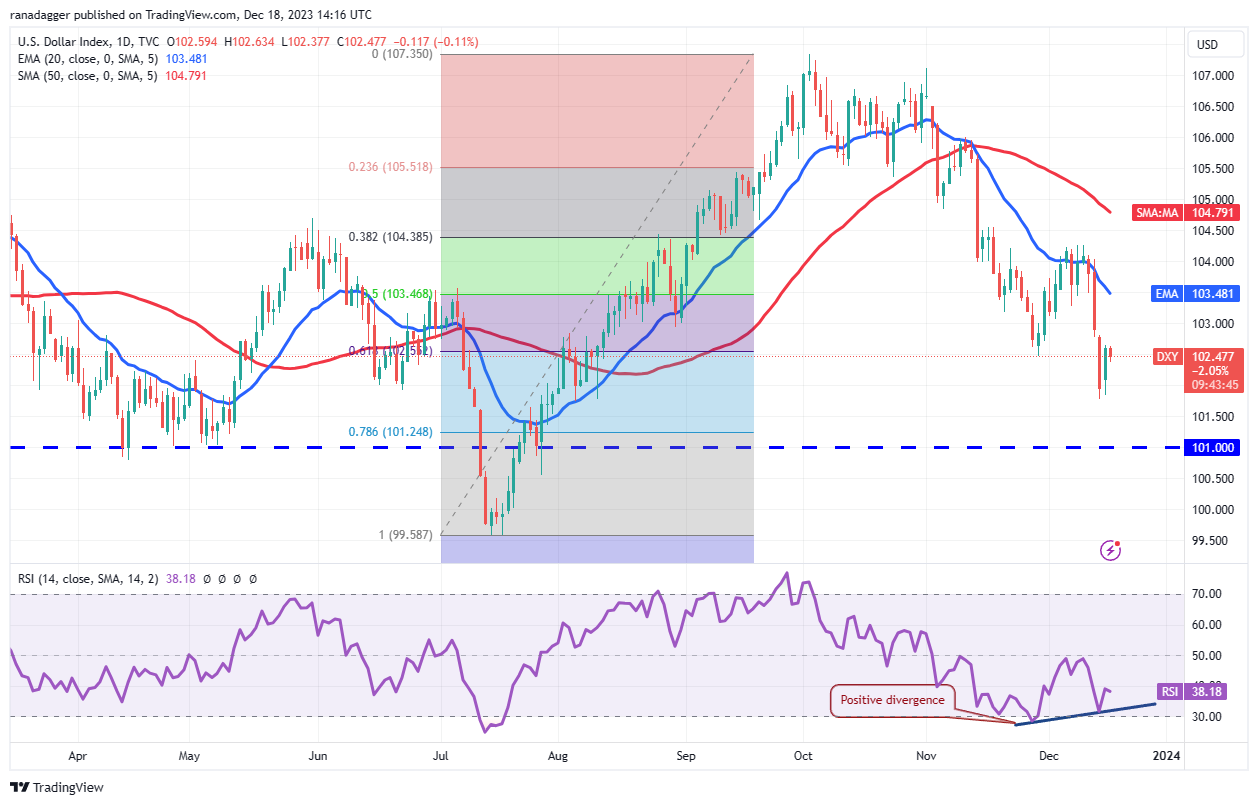
The bulls repeatedly failed to maintain the U.S. dollar Index (DXY) above the 20-day EMA (103) between Dec. 5-13.

That encouraged the bears to renew their selling, driving the index lower. The bears yanked the price below the 61.8% Fibonacci retracement level of 102.55 on Dec. 14, signaling the resumption of the corrective phase. The next strong support is at 101.
The RSI is showing early signs of forming a positive divergence, indicating that the selling pressure could be weakening. If the price rebounds off 101 and rises above the 20-day EMA, the index may…
Click Here to Read the Full Original Article at Cointelegraph.com News…
