Bitcoin (BTC) has failed to rebound sharply following the fall on Dec. 11, suggesting selling pressure on relief rallies. Glassnode data shows that short-term holders (STHs), entities holding Bitcoin for 155 days or less, sent $1.93 billion worth of Bitcoin to exchanges on Dec. 11 and $2.08 billion on Dec. 12. The last time single-day selling crossed the $2 billion mark was way back in June 2022. This shows that speculators are in a hurry to dump their holdings.
However, lower levels are attracting buyers. Trading resource Material Indicators suggested that “institutional sized” bids could be seen but added that it was unclear if it was accumulation or a short-term trading opportunity with dips being purchased and rallies being sold.
Cointelegraph contributor Marcel Pechman analyzed derivatives data and said that Bitcoin remains on track to hit $50,000 despite the recent correction. He added that chances of “cascading liquidations” were low as the correction seems to have been “primarily driven by the spot market.”
What are the important support levels on Bitcoin that are likely to hold? Could altcoins also start a relief rally? Let’s analyze the charts of the top 10 cryptocurrencies to find out.
Bitcoin price analysis
Bitcoin has been holding above the 20-day exponential moving average ($40,870), but the bulls have failed to start a strong relief rally. This suggests hesitation to buy at higher levels.
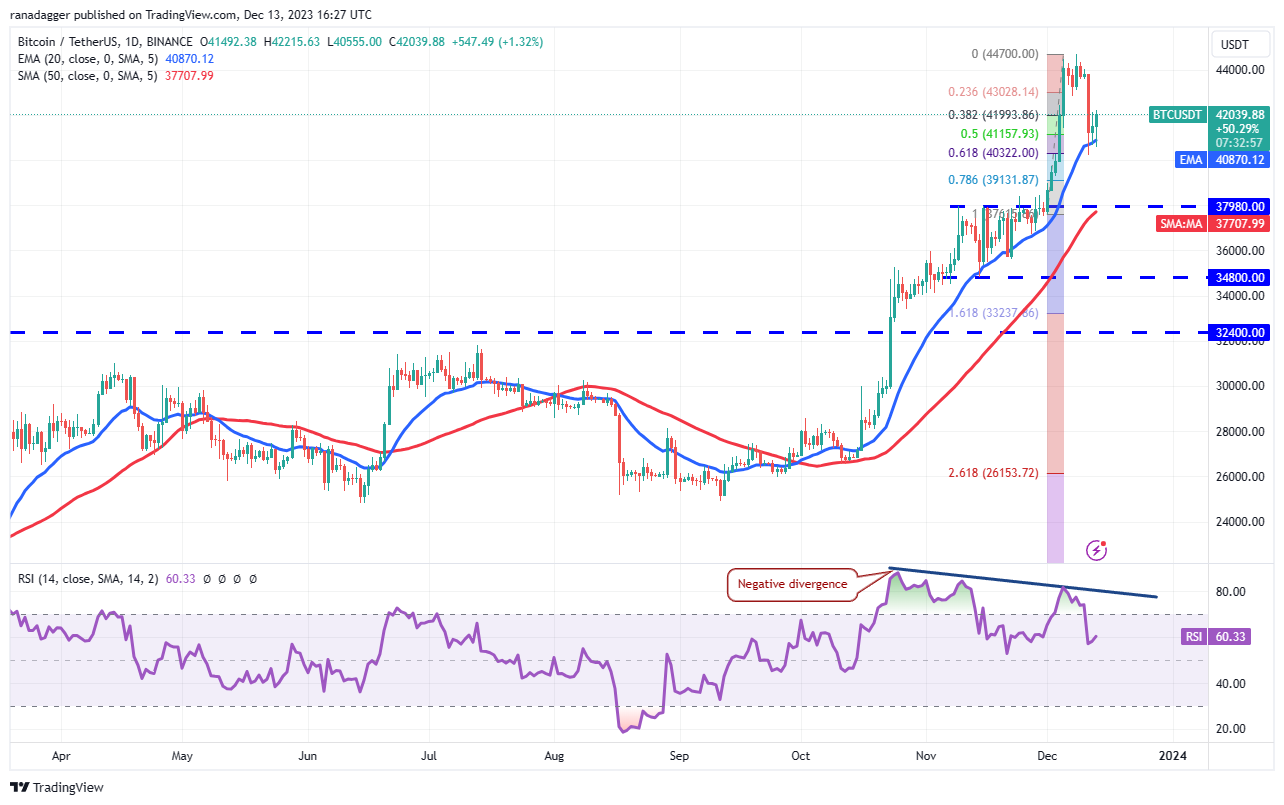
The negative divergence on the relative strength index (RSI) suggests that the positive momentum could be slowing down. That puts the 20-day EMA at risk of breaking down. If that happens, the BTC/USDT pair could plummet to the 50-day simple moving average ($37,707).
Meanwhile, the bulls are likely to have other plans. They will try to push the price to the overhead resistance at $44,700. This level is expected to witness a tough battle between the bulls and the bears. If the buyers prevail, the pair could soar to $48,000.
Ether price analysis
Ether’s (ETH) shallow bounce off the strong support at $2,200 on Dec. 12 suggests a lack of demand at lower levels.
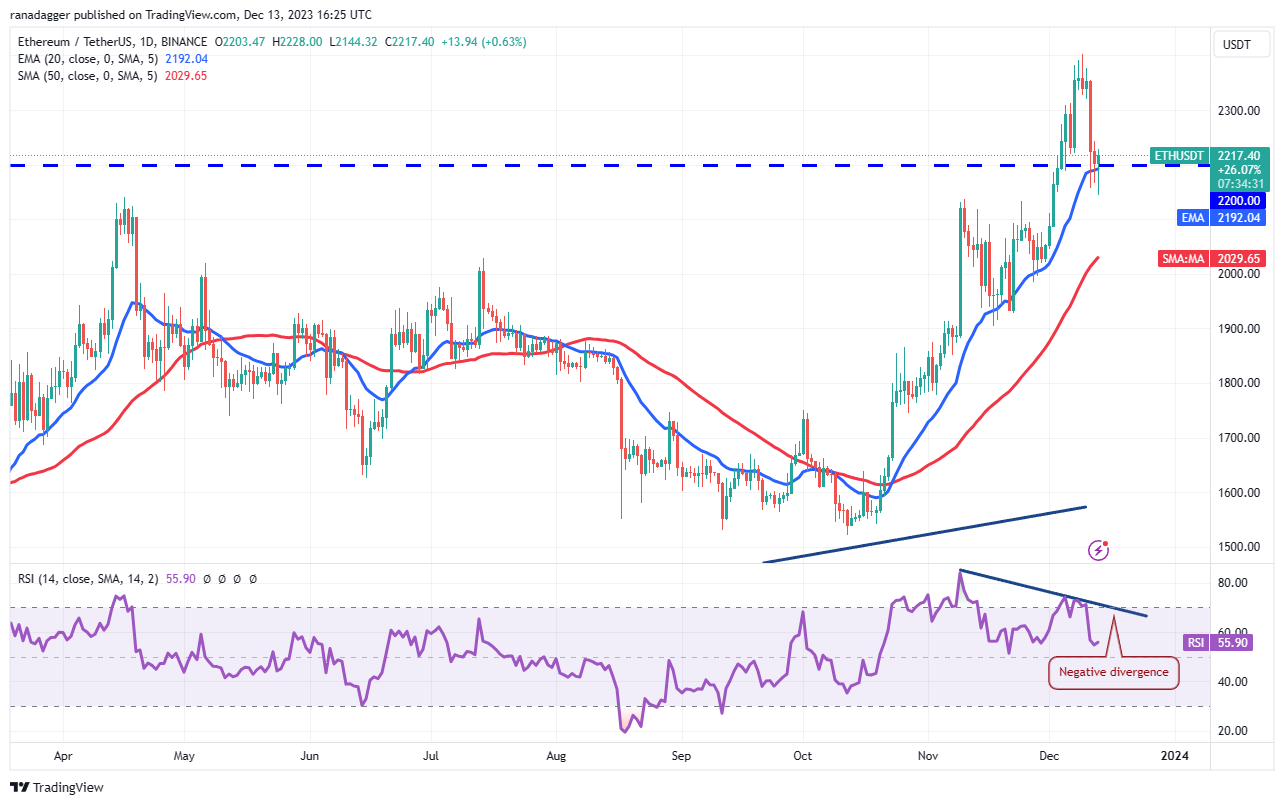
The bears are trying to build upon their advantage by pulling the price below the 20-day EMA ($2,192). If they sustain the lower levels, the selling could accelerate, and the ETH/USDT pair could tumble to the 50-day SMA ($2,029).
Conversely, if the price turns…
Click Here to Read the Full Original Article at Cointelegraph.com News…