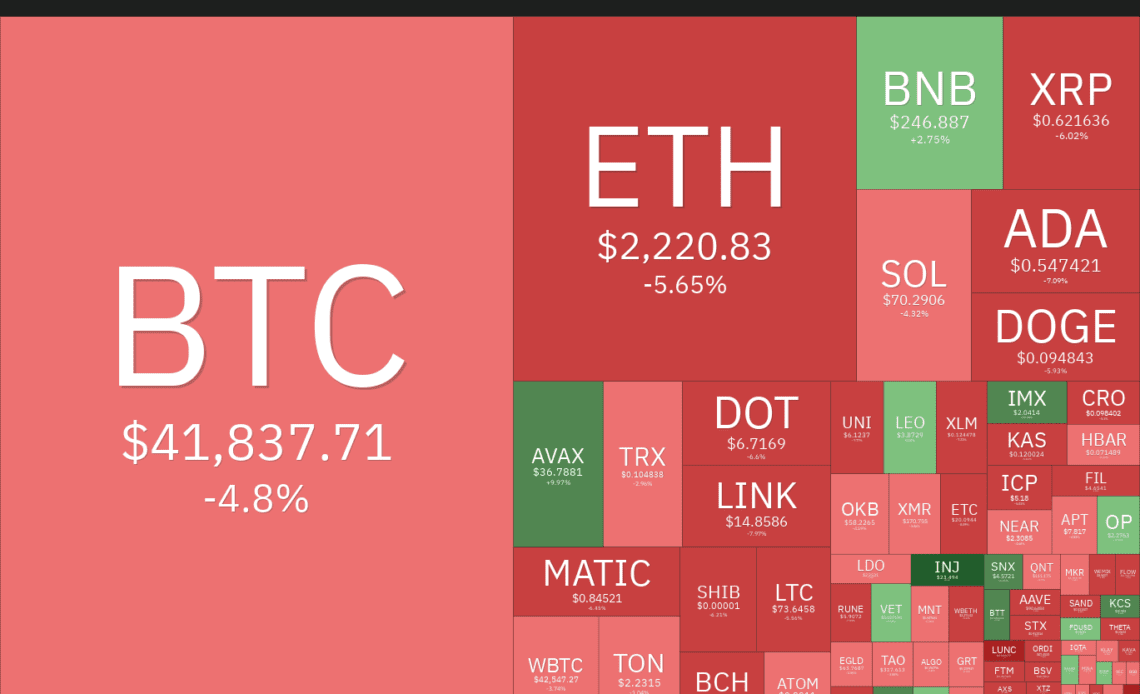
Bitcoin (BTC) closed last week with gains of 9.55%, but started the new week on a weak note, falling near $40,500. The sharp correction in Bitcoin also caused liquidations in several altcoins. According to CoinGlass data, cross-crypto long liquidations for Dec. 11 were more than $300 million.
The sharp fall does not change the trend in Bitcoin and altcoins, as corrections are a part and parcel of any uptrend. Generally, vertical rallies are followed by sharp pullbacks, which shake out the weaker hands and allow long-term investors to buy more at lower levels.
The corrections are unlikely to stretch longer due to several bullish catalysts in 2024. Analysts expect one or more Bitcoin exchange-traded funds to receive regulatory approval in January, which could be a game changer. That will be followed by Bitcoin halving in April, and finally, expectations of a rate cut by the United States Federal Reserve could boost risky assets. Goldman Sachs anticipates the Fed to start cutting rates in the third quarter of 2024.
What are the important levels that could arrest the fall in Bitcoin and altcoins? Let’s analyze the charts to find out.
S&P 500 Index price analysis
The bulls have successfully held the S&P 500 Index (SPX) above the breakout level of 4,541 for the past several days. This suggests that the buyers are trying to flip the level into support.
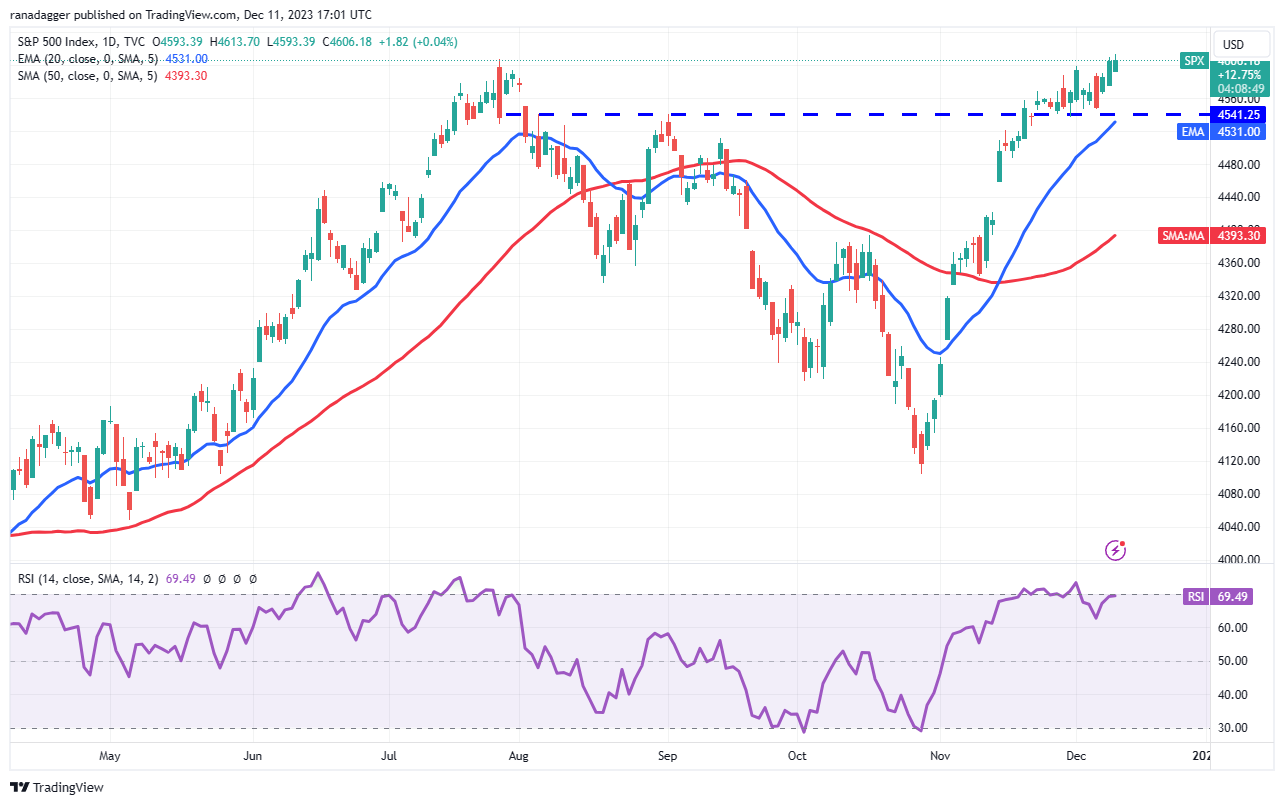
The upsloping 20-day exponential moving average (4,531) and the relative strength index (RSI) near the overbought zone indicate that the path of least resistance is to the upside. If buyers pierce the overhead resistance at 4,650, the index could pick up momentum and surge to 4,800.
This bullish view will be invalidated in the near term if the price turns down and plunges below the 20-day EMA. That will indicate aggressive selling at higher levels. The index may then tumble to the 50-day simple moving average (4,393).
U.S. Dollar Index price analysis
The U.S. Dollar Index (DXY) bounced off the 61.8% Fibonacci retracement level of 102.55 on Nov. 29, indicating buying at lower levels.
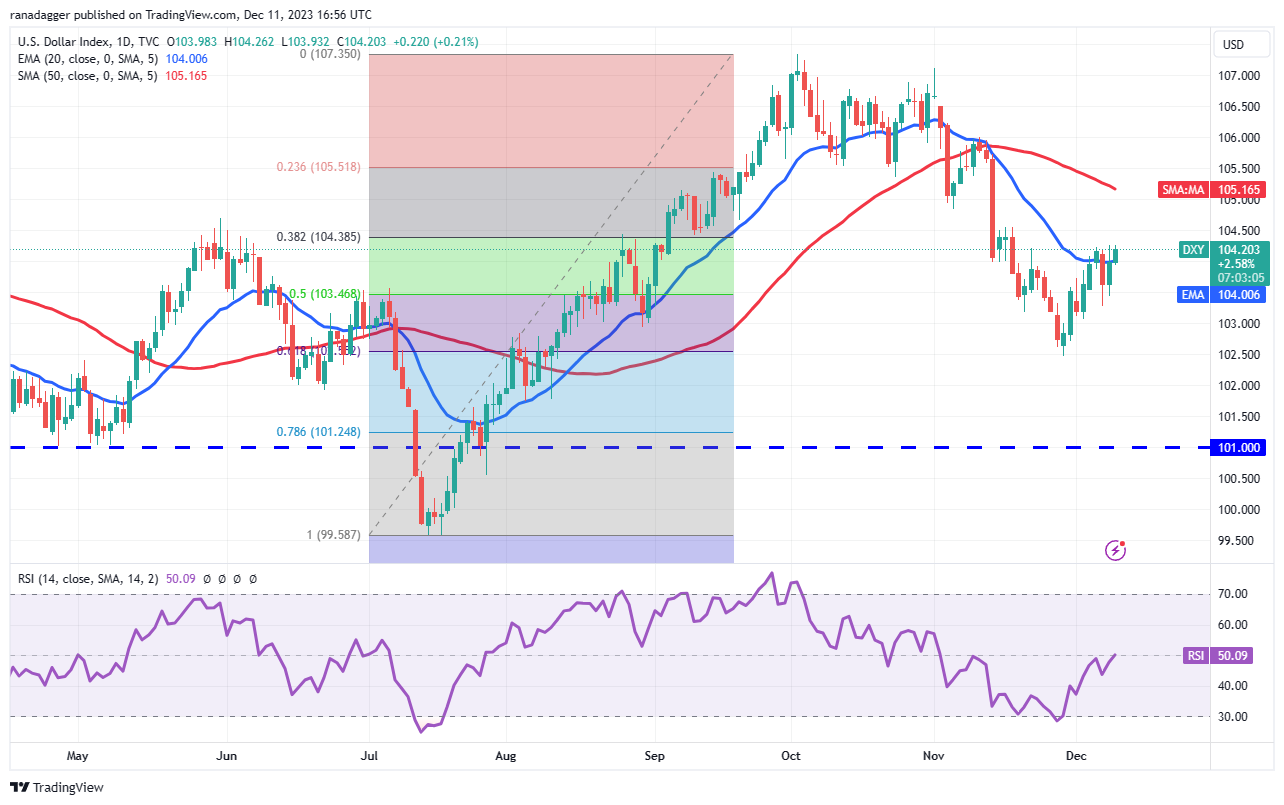
The relief rally has reached the 20-day EMA (104), where the bears are mounting a stiff defense. A minor positive in favor of the bulls is that they have not allowed the price to dip much below the 20-day EMA.
There is a minor resistance at 104.50, but if this level is scaled, the index could rise to the 50-day…
Click Here to Read the Full Original Article at Cointelegraph.com News…