The debt ceiling negotiations in the United States are keeping traders on the edge. JPMorgan Chase CEO Jamie Dimon recently told Bloomberg on May 11 that a possible sovereign default by the U.S. government could create panic in the stock markets, resulting in heightened volatility.
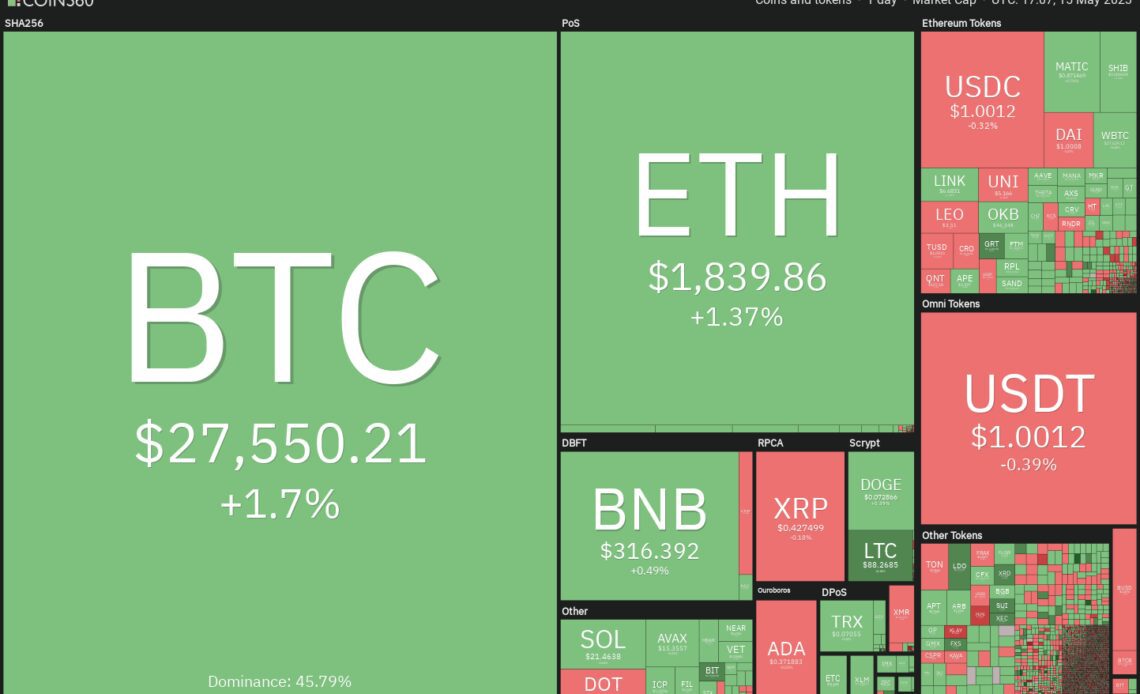
The next big question troubling crypto investors is how will Bitcoin react to such an event. Bloomberg’s latest Markets Live Pulse survey indicates that Bitcoin (BTC) could be the third most preferred asset class behind Gold and U.S. Treasuries should the U.S. government fail to prevent a debt default.
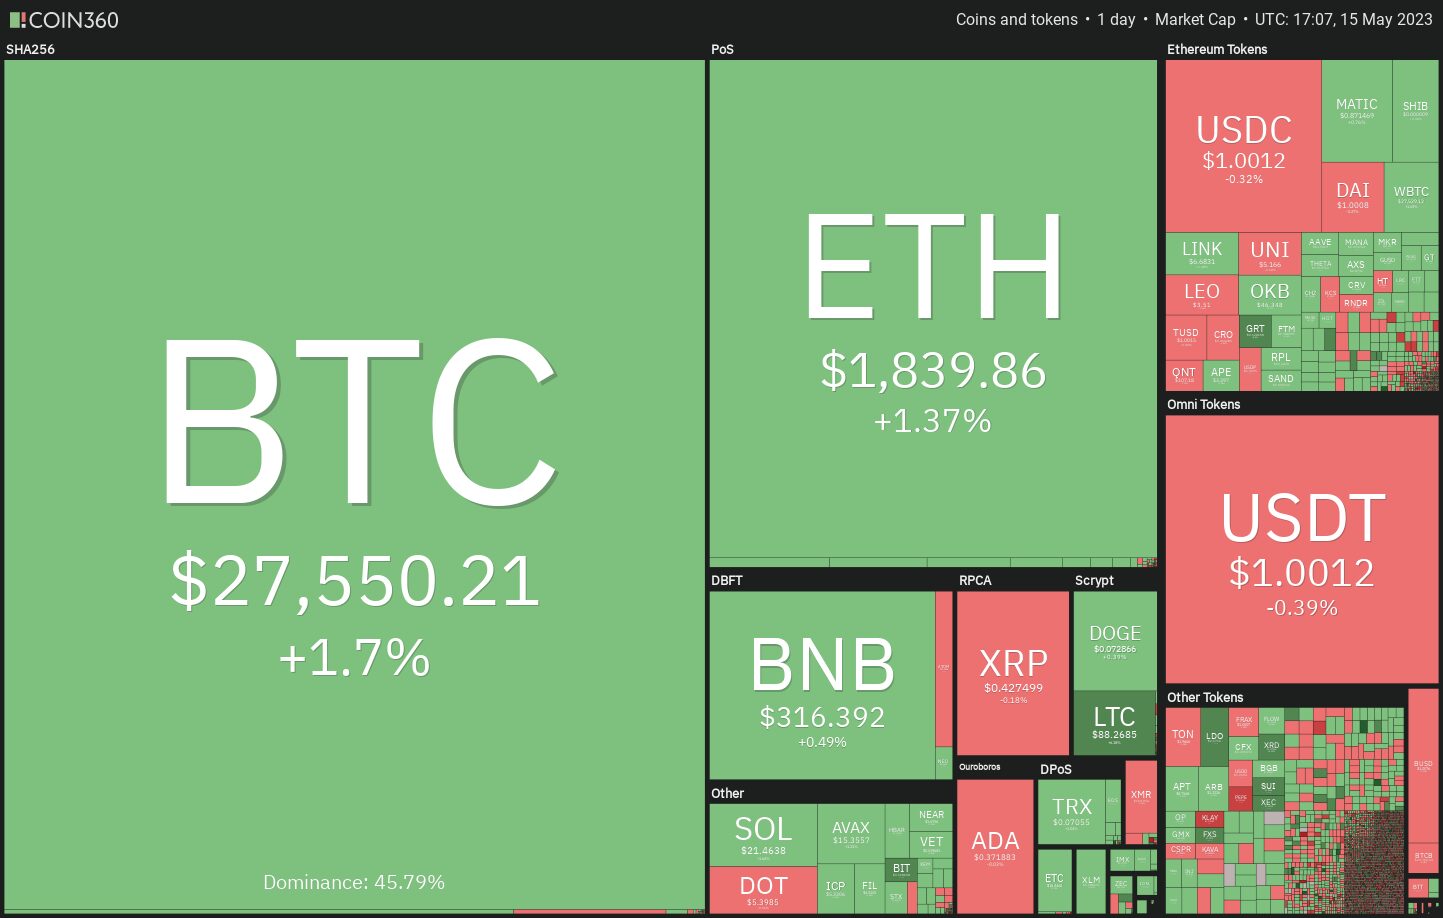
Billionaire fund manager Paul Tudor Jones told CNBC that he is holding his Bitcoin and will always have some portion of his portfolio in it.
What are the important support and resistance levels to watch for in the S&P 500 Index (SPX), Bitcoin, and the major altcoins? Let’s study the charts to find out.
S&P 500 Index price analysis
The S&P 500 Index has been trading near the 20-day exponential moving average (4,118) for the past few days. This suggests a tough battle between the bulls and the bears for supremacy in the near term.
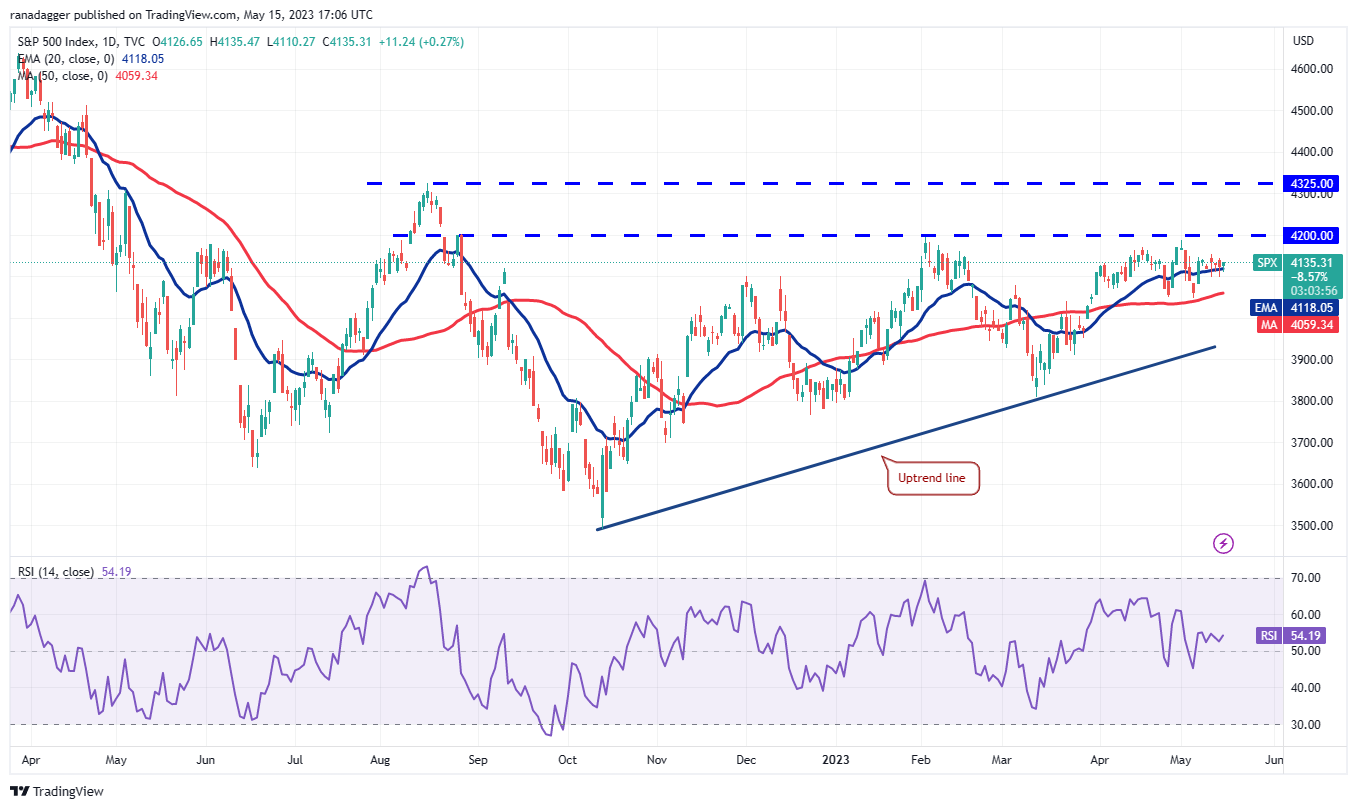
The gradually rising 20-day EMA and the relative strength index (RSI) near the midpoint suggest a range-bound action in the short term. The index could swing between the overhead resistance of 4,200 and the 50-day simple moving average (4,059) for a few more days.
A break and close below the 50-day SMA could pull the price to the uptrend line. If this support also gives way, the index may nosedive to 3,800.
On the upside, the bulls will have to clear the hurdle at 4,200. The index may then rally to 4,325 where the bears will again pose a strong challenge. During the correction from this level, if buyers flip 4,200 into support, it will enhance the prospects of a rally above 4,325.
U.S. dollar index price analysis
After being unsuccessful for a few days, the bulls finally managed to push and sustain the U.S. dollar index (DXY) above the 20-day EMA (101.88) on May 11.
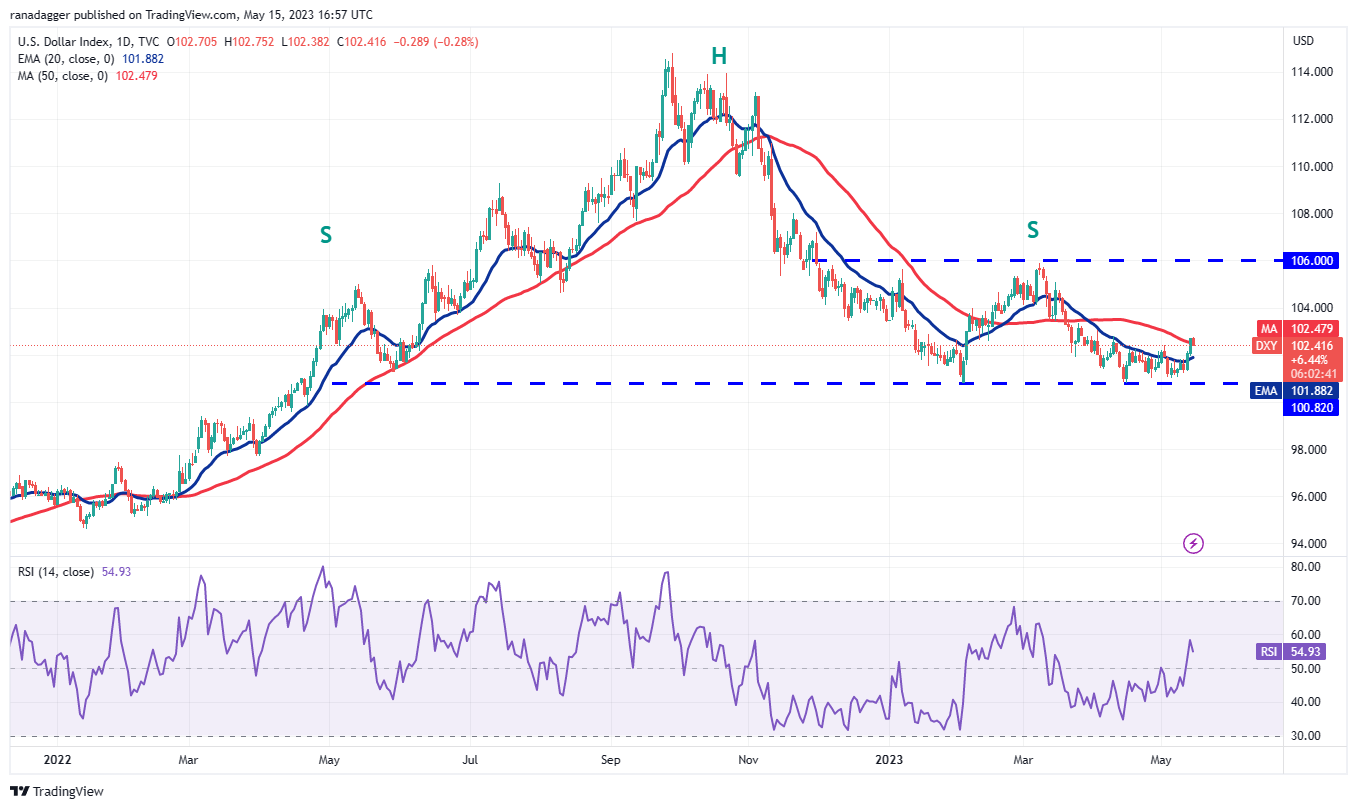
The bulls continued their buying and cleared the overhead hurdle at the 50-day SMA (102.47) on May 12. The 20-day EMA has started to turn up gradually and the RSI has jumped into the positive zone, indicating that bulls have a slight edge. The index could rise to 103.50 in the short term where it is again likely to face selling from the bears.
Conversely, if the price…
Click Here to Read the Full Original Article at Cointelegraph.com News…