Bitcoin (BTC) barely held $27,000 on April 22 as another round of losses left bulls with little firepower.
Giant RSI support retest greets Bitcoin bulls
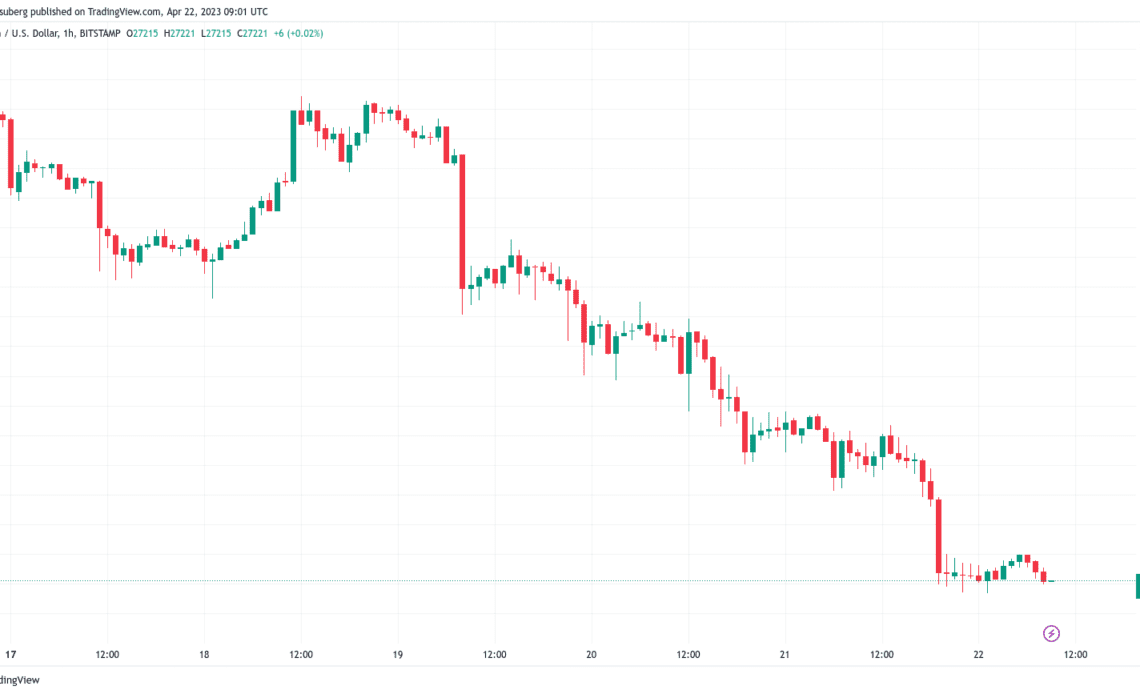
Data from Cointelegraph Markets Pro and TradingView showed BTC/USD just preserving the $27,000 mark on the day after the Wall Street trading week ended on a sour note.
In contrast to United States equities, which managed to seal modest gains on the day, Bitcoin continued to suffer as analysts warned of a return to nearer $25,000.
With that, BTC/USD was down 10% for the week and 4% in April overall, according to data from monitoring resource Coinglass, amid a dramatic turnaround in fortunes versus much of Q1.

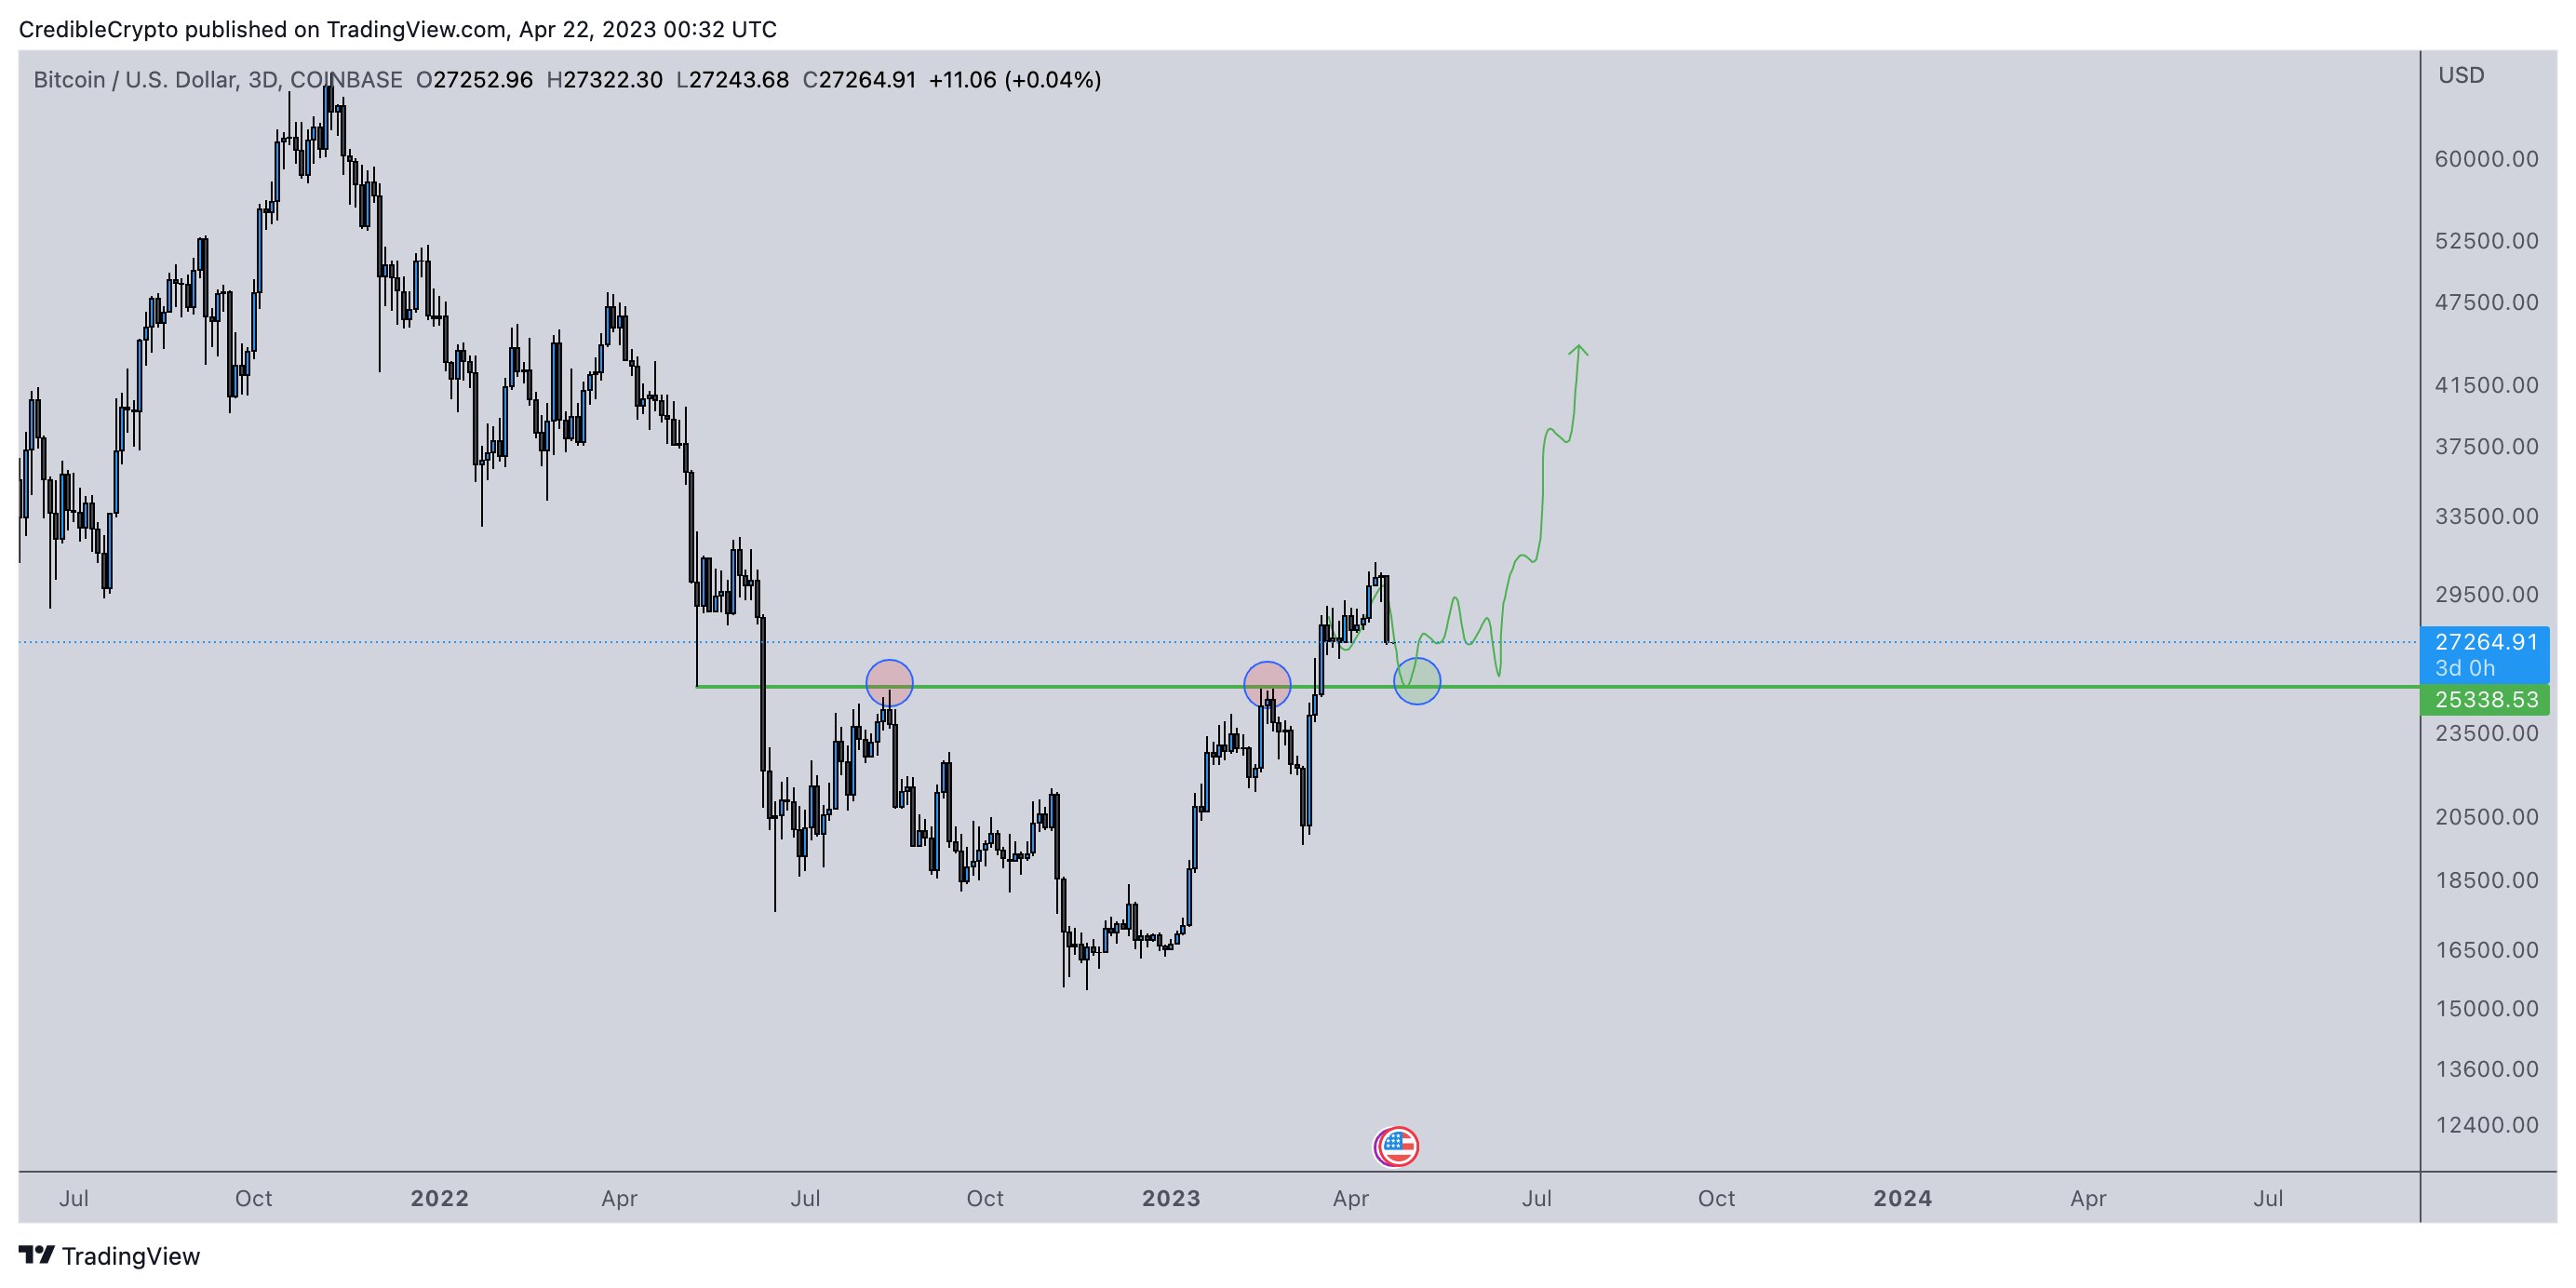
For popular trader Credible Crypto, however, there was still every reason to hope that the long-term uptrend remained intact.
“If your macro thesis on Bitcoin has changed because of a $2,000 pullback after a $10,000+ vertical rally from 19k to 30k+ you’re doing it wrong,” he insisted in part of his latest Twitter commentary.
An additional post argued that such price action was “common” in crypto markets.
“The last major retest we had was at 19k before our rally to 30k+. A retest of 25k here would be logical and healthy,” it stated.
Financial information resource Stockmoney Lizards agreed, telling Twitter followers that the road higher may be slow and steady.
“After these huge green candles, we usually find some cooldown,” it wrote about the 3-month BTC/USD chart.
“Short-/mid-term still bullish (3 months), but don’t expect it to go too fast.”
Crypto analyst CryptoCon delivered similar conclusions on the basis of the latest movements in Bitcoin’s relative strength index (RSI).
Used to determine overbought and oversold conditions at given price points, RSI can help offer insights into forthcoming price trends.
“Short term Bitcoin price action seems grim, but behind the scenes, the Weekly RSI has broken out of a 6-year downtrend and is now attempting to make support,” it revealed, comparing the latest action to prior halving cycles.
“Bitcoin is now at decision point. Continue 2019 parabolic price action, or take the healthier, steady 2015 approach?”

BTC price analyst expects “stronger buy interest” near $25,000
Trader Skew meanwhile delved into the potential…
Click Here to Read the Full Original Article at Cointelegraph.com News…