The recent banking crisis in the United States seems to have shaken the belief of some customers in the legacy banking system. According to Federal Reserve data, customers pulled nearly $100 billion in deposits in the week ending March 15.
American venture capital investor and entrepreneur Tim Draper said in a March 25 report that “founders need to consider a more diversified cash management approach” due to the over-regulation of banks and micromanagement by the government. As part of a contingency plan, Draper suggested businesses keep “ at least 6 months of short-term cash in each of two banks, one local bank and one global bank, and at least two payrolls worth of cash in Bitcoin (BTC) or other cryptocurrencies.”
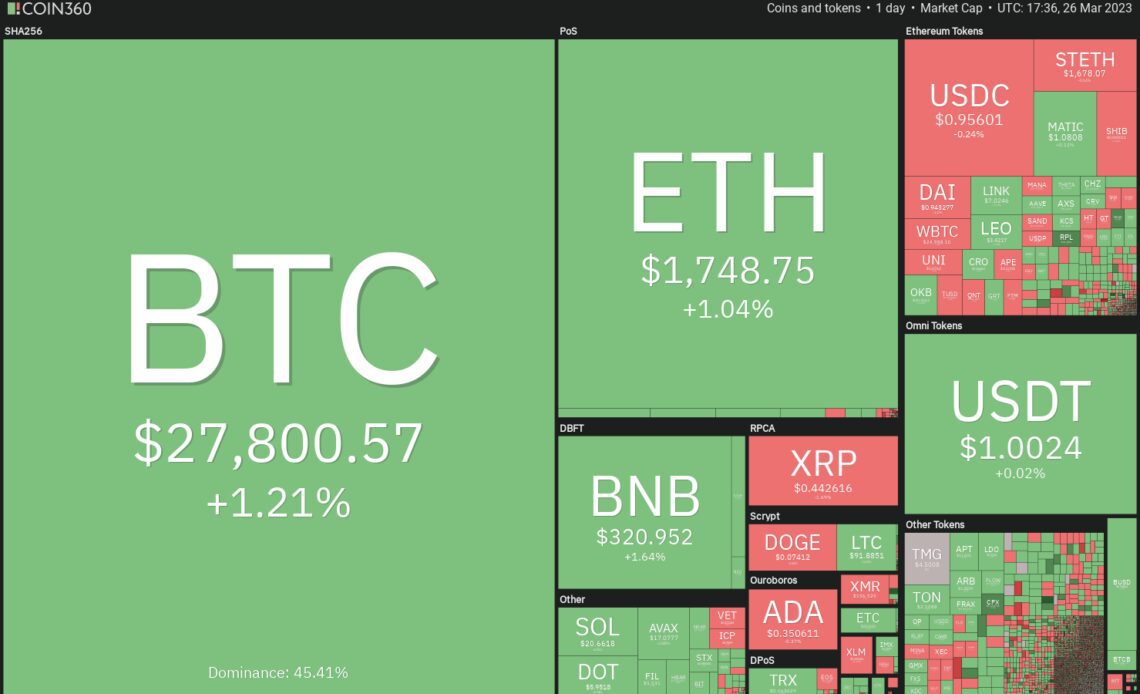
The move from the traditional banking system to cryptocurrencies may have already started as seen from the strong showing of Bitcoin in the past few days. Even after the recent up-move, investors do not seem to be hurrying to book profits in Bitcoin. However, the same cannot be said about most altcoins as they have witnessed a minor pullback.
In the short term, traders need to be selective of the cryptocurrencies to trade. Let’s study the charts of Bitcoin and select altcoins which may start the next leg of the up-move.
Bitcoin price analysis
Bitcoin has been hovering around the $28,000 level for the past few days. A consolidation after a strong rally is a positive sign as it shows that traders are holding on to their position, expecting a further up-move.

The upsloping 20-day exponential moving average ($25,936) and the relative strength index (RSI) in the positive area suggest the bulls remain in control. That enhances the prospects of a break above $28,900.
If that happens, the BTC/USDT pair could rally to the $30,000 to $32,000 resistance zone. The bears will try to defend this zone with all their might because if they fail in their endeavor, the pair may skyrocket to $40,000.
The vital support on the downside is $25,250. If this level fails to hold up, the pair may tumble to the 200-day simple moving average ($20,179).
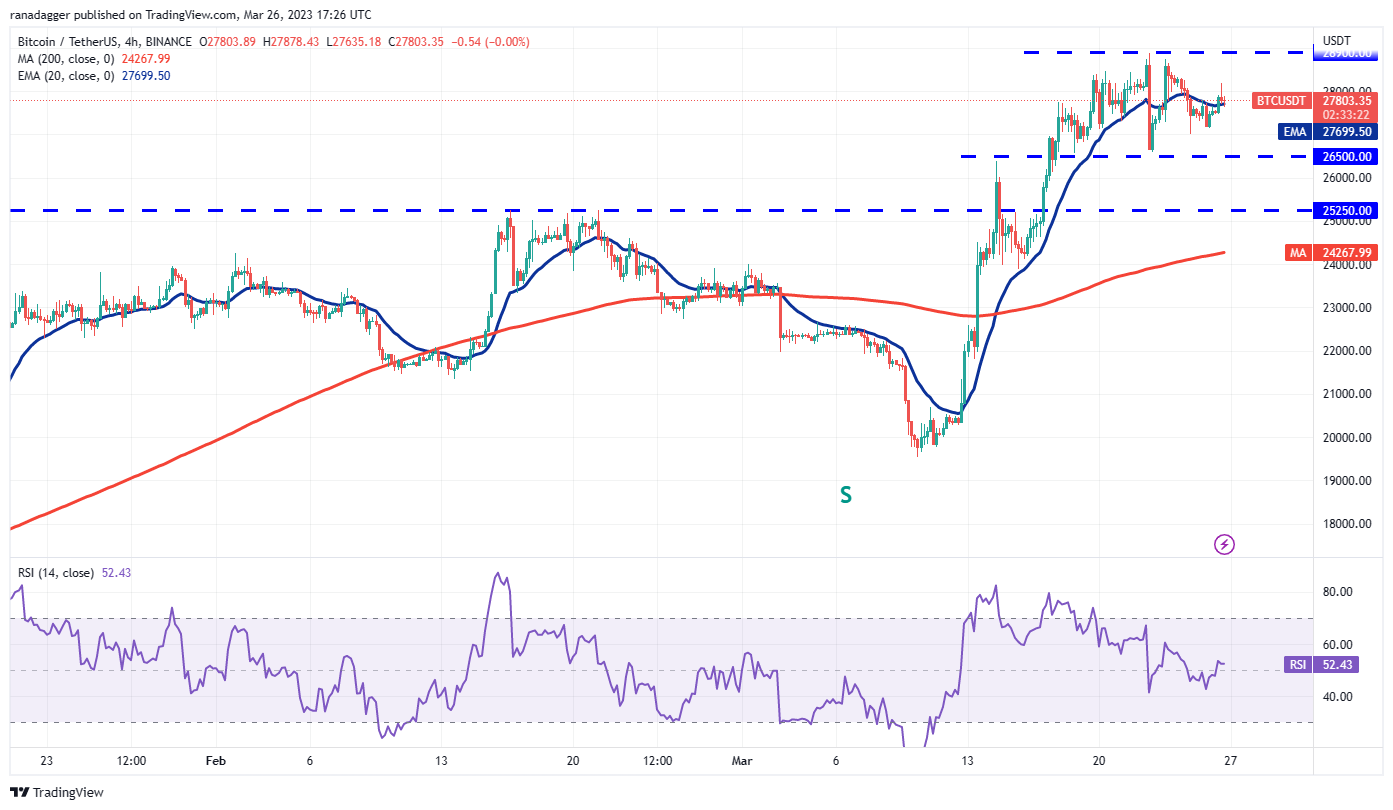
The 4-hour chart shows that the pair has been trading in a range between $26,500 and $28,900 for some time. The 20-EMA is flat and the RSI is just above the midpoint, indicating a balance between supply and demand.
A break above $28,900 will signal that bulls have overpowered the bears. That…
Click Here to Read the Full Original Article at Cointelegraph.com News…