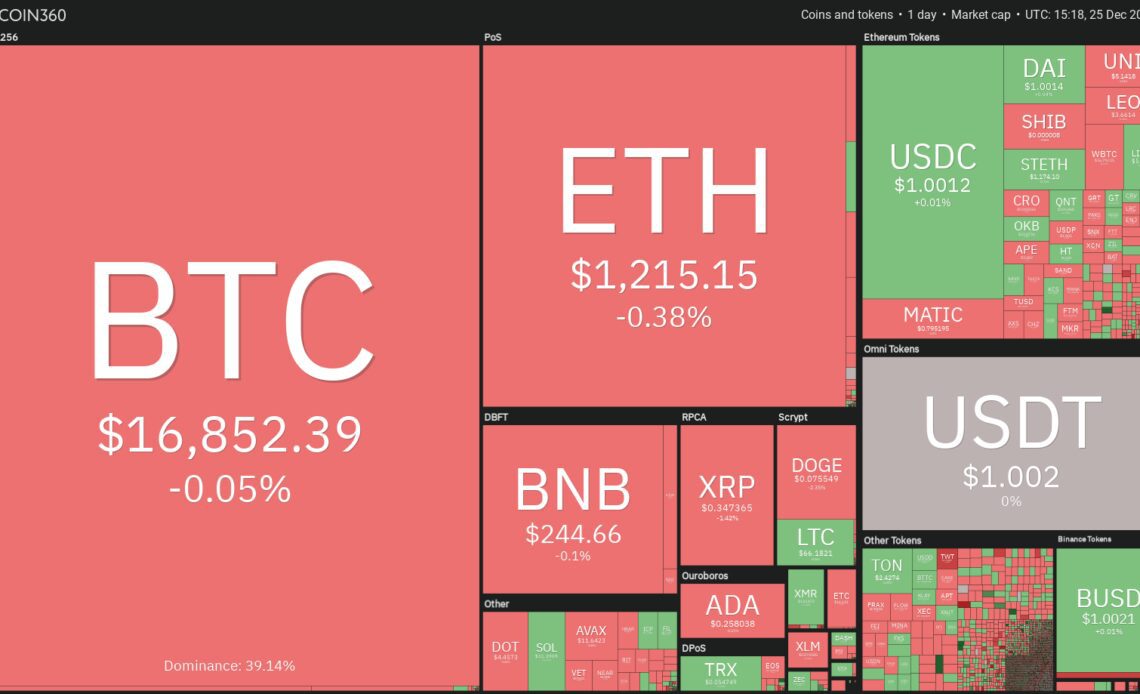
Cryptocurrency markets lack any signs of volatility going into the year-end holiday season. This suggests that both the bulls and the bears are playing it safe and are not waging large bets due to the uncertainty regarding the next directional move. This indecisive phase is unlikely to continue for long because periods of low volatility are generally followed by an increase in volatility.
Willy Woo, creator of on-chain analytics resource Woobull, anticipates that the duration of the current bear market may “be longer than 2018 but shorter than 2015.”
The crypto winter has resulted in a loss of more than $116 billion to the personal equity of 17 investors and founders in the cryptocurrency space, according to estimates by Forbes. The carnage has been so severe that the names of 10 investors were removed from the crypto billionaire list.
Could the bear market deepen further or is it showing signs of starting a relief rally? Let’s look at the charts of Bitcoin (BTC) and select altcoins to find out.
BTC/USDT
Bitcoin has been trading in a tight range near the 20-day exponential moving average ($16,929) for the past few days. This indicates that the bears are defending the level but the bulls have not given up yet.
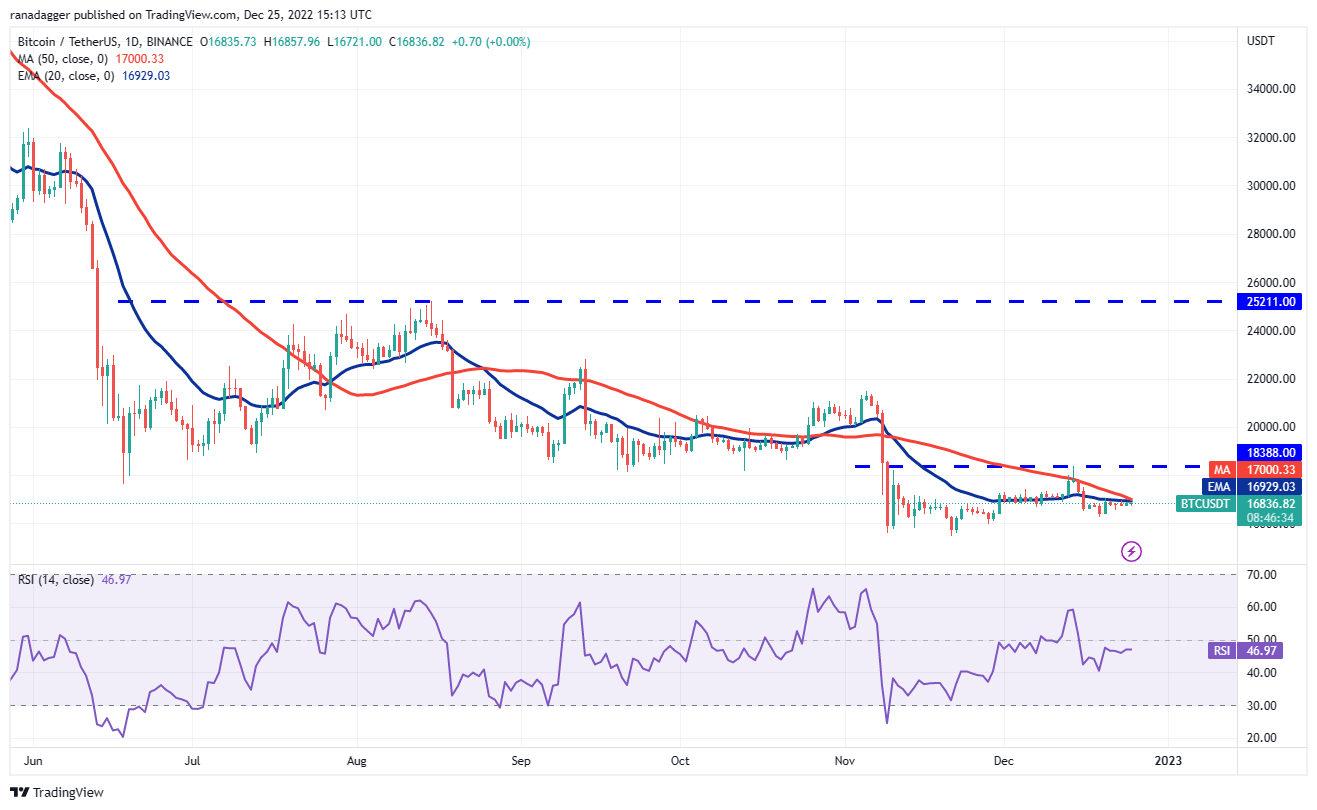
This period of calm is unlikely to continue for long and the BTC/USDT pair may soon witness a range expansion. Generally, it is difficult to predict the direction of the breakout, hence it is better to wait for the pair to make a decisive move before initiating directional bets.
If the price breaks above the moving averages, the likelihood of a rally to the overhead resistance at $18,388 increases. This level may again act as a major roadblock but if the bulls force their way through, the momentum could pick up and the pair could rally to $20,000.
On the way down, a break below $16,256 could signal that bears are in control. The sellers will then attempt to sink the pair to the vital support at $15,476.
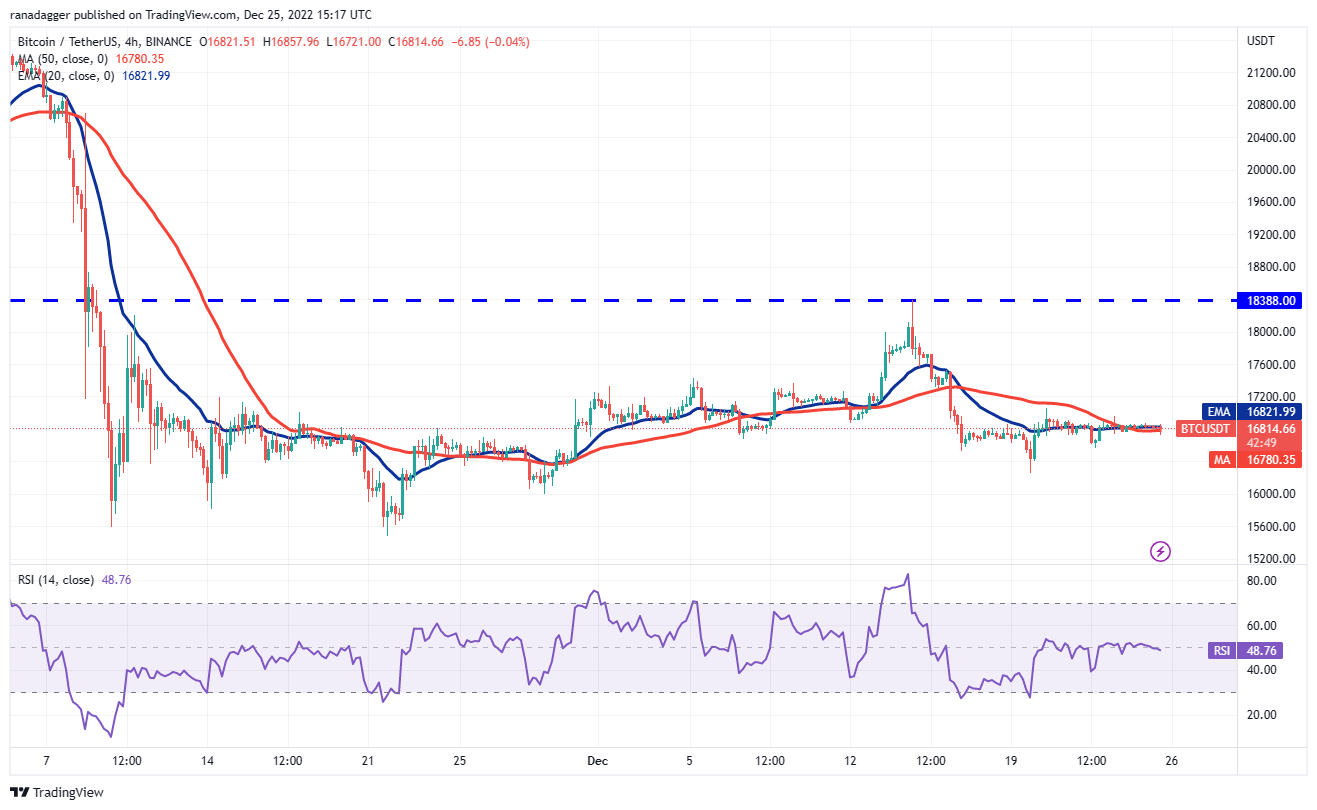
Both moving averages on the 4-hour chart have flattened out and the relative strength index (RSI) is just below the center. This suggests a range-bound action in the near term. The boundaries of the range could be $17,061 on the upside and $16,256 on the downside.
A break above $17,061 will indicate that the bulls have come out on top and that could start a short-term up-move. On the other hand, a slump below $16,256 will…
Click Here to Read the Full Original Article at Cointelegraph.com News…