Key takeaways:
-
Web3 daily activity held steady at 24 million in Q2 2025, but sector composition is shifting.
-
DeFi leads transaction counts with 240 million weekly, yet Ethereum gas usage is now dominated by the RWA, DePIN and AI.
-
Smart contract platforms’ coins and yield-generating DeFi and RWA tokens outperform the market, while AI and DePIN lag despite strong narratives.
Altcoins are more than speculative bets on coins outside Bitcoin. In most cases, they represent — or aim to represent — specific activity sectors within Web3, a decentralized alternative to the legacy internet and its services.
Assessing the state and potential of the altcoin market means looking beyond prices. Key indicators such as gas usage, transaction counts, and unique active wallets (UAW) help gauge activity and adoption, while coin price performance reveals whether markets follow onchain trends.
AI and social DApps gain adoption
UAW counts distinct addresses interacting with DApps, offering a proxy for adoption breadth, though multiple wallets per user and automated activity can skew results.
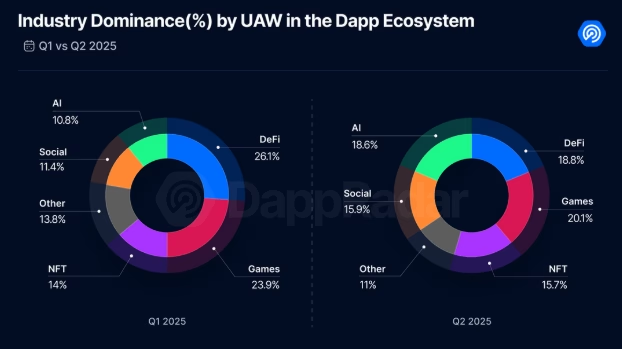
DappRadar’s Q2 2025 report shows steady daily wallet activity at around 24 million. Yet a shift in sector dominance is emerging. Crypto gaming remains the largest category, with over 20% market share, though down from Q1. DeFi has also slipped, falling from over 26% to below 19%. In contrast, Social and AI-related DApps are gaining traction. Farcaster leads Social with roughly 40,000 daily UAW, while in AI, agent-based protocols like Virtuals Protocol (VIRTUAL) are standing out, attracting 1,900 weekly UAW.
DeFi attracts big players
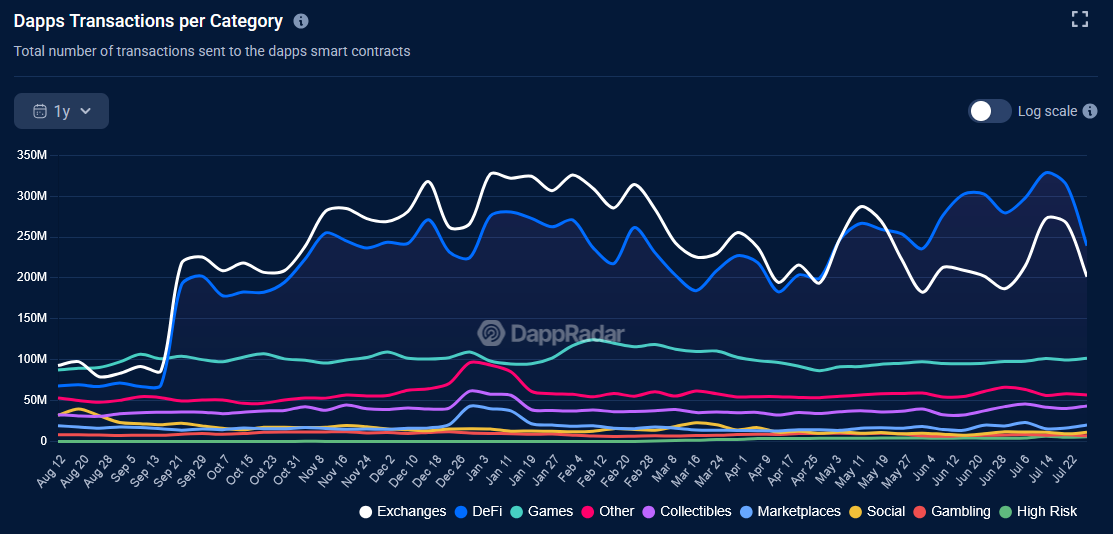
Transaction counts show how often smart contracts are triggered, but can be inflated by bots or automation.
DeFi’s transaction footprint is paradoxical. Its user base has declined, yet it still generates over 240 million weekly transactions — more than any other Web3 category. Exchange-related activity (can overlap with DeFi) adds to this dominance, with crypto gaming trailing at 100 million weekly transactions and the “Other” category (excluding Social but including AI) at 57 million.
Total value locked (TVL) tells an even stronger story. According to DefiLlama, DeFi TVL has reached $137 billion — up 150% since January 2024, though still below its $177 billion peak in late 2021. The divergence between rising TVL and falling UAW reflects a key theme of this…
Click Here to Read the Full Original Article at Cointelegraph.com News…