Key points:
-
Bitcoin finds support at lower levels, but may face strong selling in the $120,000 to $123,218 zone.
-
Net Ether ETF inflows of more than $1 billion on Monday suggest solid institutional demand.
Bitcoin’s (BTC) strong rejection near the all-time high of $123,218 signals that bears are unlikely to surrender without a fight. BTC’s failure to hit a new all-time high resulted in a pullback in several altcoins, but a few have bounced back sharply.
Select analysts have turned cautious on BTC following Monday’s rejection. ZAYK Charts said in a post on X that the Wyckoff method suggests that BTC may have entered a distribution phase, and a confirmation of the same could sink the price toward $95,000.
In comparison, Ether (ETH) has remained strong. According to Farside Investors’ data, Spot ETH exchange-traded funds (ETFs) recorded their highest-ever net inflows of $1.01 billion on Monday.
Could BTC surprise to the upside? Will ETH lead the altcoins higher? Let’s analyze the charts of the top 5 cryptocurrencies that look strong on the charts in the near term.
Bitcoin price prediction
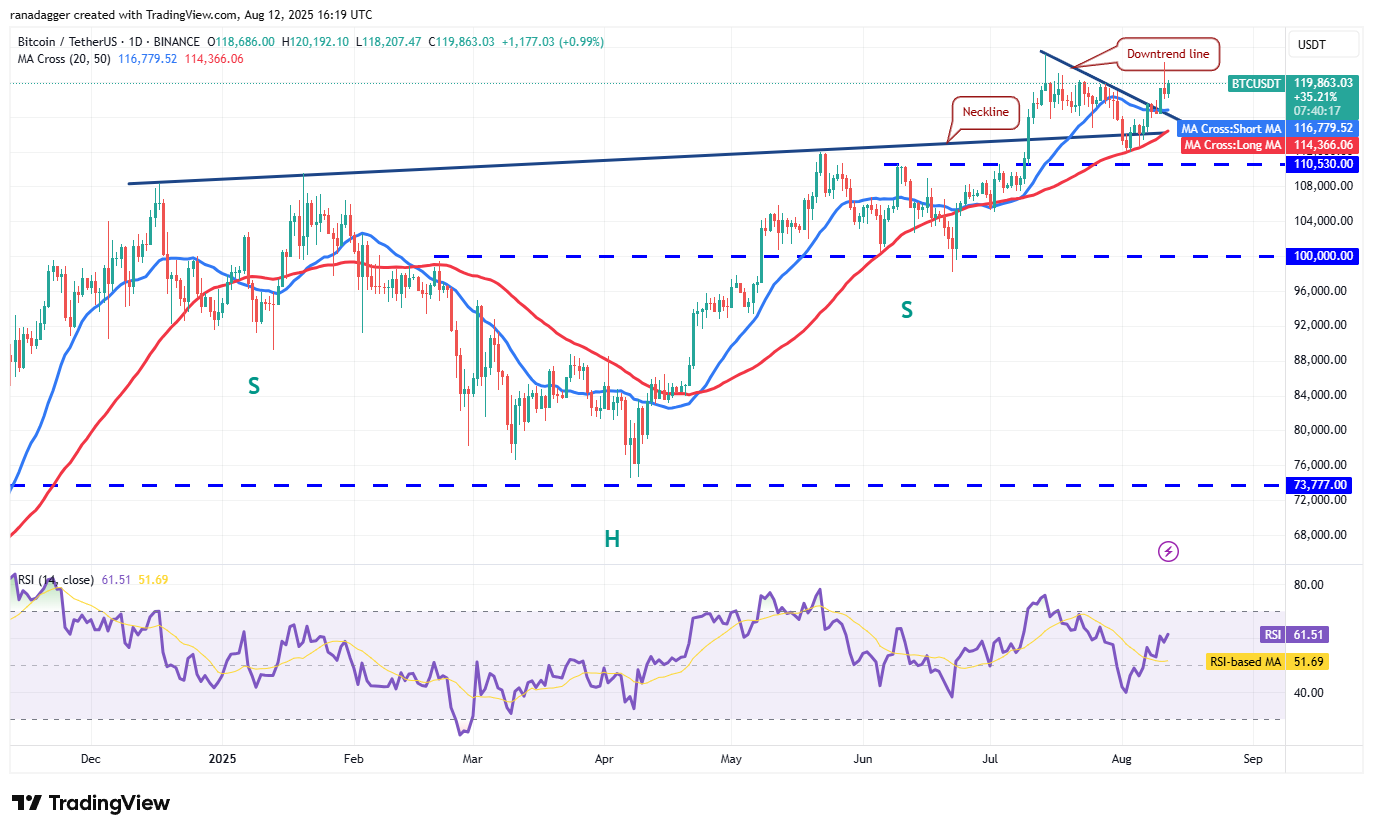
Sellers successfully thwarted buyers’ attempts to thrust BTC to a new all-time high above $123,218 on Monday.

The flattish 20-day simple moving average ($116,779) points to a balance between supply and demand, but the relative strength index (RSI) in the positive territory suggests the momentum favors the bulls. If the price stays above the 20-day SMA, the bulls will again attempt to drive the BTC/USDT pair above $123,218. If they can pull it off, the Bitcoin price could skyrocket toward $135,000.
Conversely, a drop below the 20-day SMA signals profit-booking by short-term traders. That could sink the pair to the 50-day SMA ($114,366), indicating a possible range formation in the near term. Sellers will have to tug the price below $110,530 to seize control.

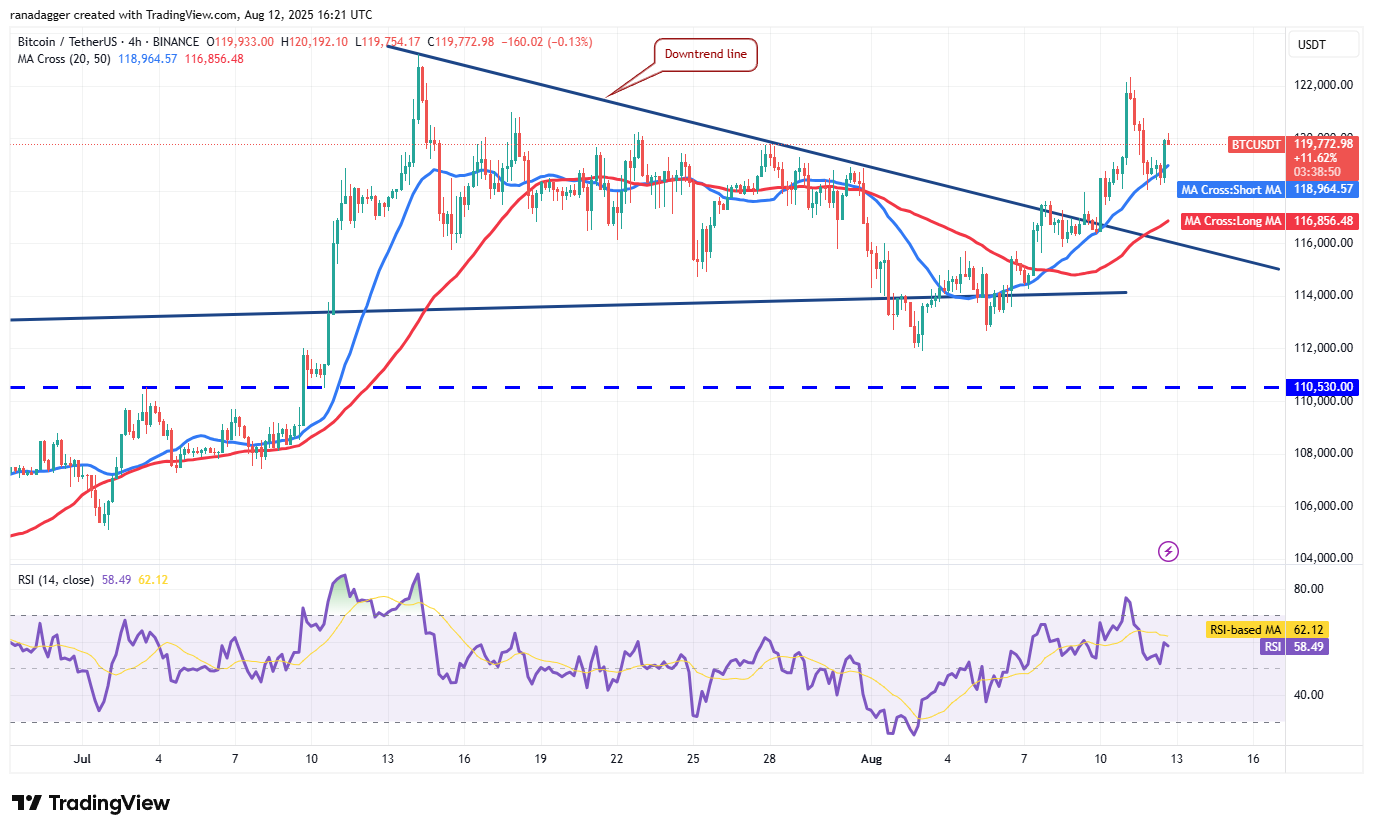
The pair has bounced off the 20-SMA on the 4-hour chart. The upsloping moving averages and the RSI in the positive territory indicate an advantage to buyers. If the $123,218 resistance is taken out, the pair could soar to $127,735 and later to $135,000.
Sellers are likely to have other plans. They will try to pull the price back below the downtrend line. If they do that, Bitcoin’s price could range between $123,218 and $111,920 for some time.
Ether price…
Click Here to Read the Full Original Article at Cointelegraph.com News…
