Key points:
-
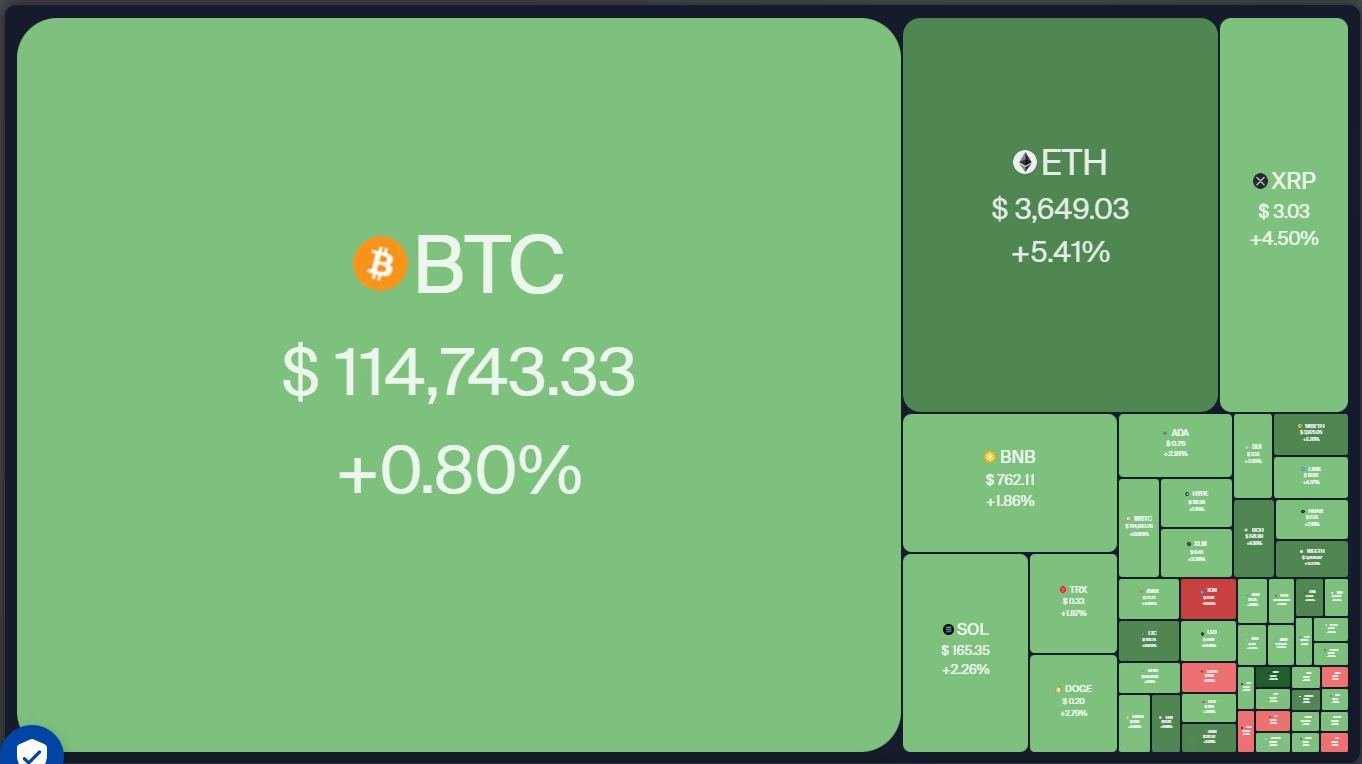
Bitcoin is trying to take support near $112,000, but higher levels are likely to attract selling by the bears.
-
The deep pullback in several altcoins suggests the next leg of the up move may not happen in a hurry.
Bitcoin (BTC) bulls are trying to maintain the price above $115,000, but are facing stiff resistance from the bears. Maelstrom Fund chief investment officer Arthur Hayes said in a comment to a post on X that sluggish credit market and slowed job creation could sink BTC to $100,000 and Ether (ETH) to $3,000.
US spot BTC exchange-traded funds (ETFs) and ETH ETFs fund flows also showed cautiousness among traders. Bitcoin ETFs recorded net outflows of $812.25 million on Friday, and Ethereum ETFs saw $152.26 million in outflows, ending a 20-day inflow streak per SoSoValue data.
However, the near-term uncertainty has not stopped public companies from buying more BTC and ETH. Japanese investment company Metaplanet said on Monday that it has acquired 463 BTC at an average price of about $115,895, boosting its holdings to 17,595 BTC.
On similar lines, SharpLink purchased 30,755 ETH at an average price of $3,530, taking the firm’s total holdings to 480,031 ETH.
Could BTC break above its overhead resistance? Will that start a recovery in altcoins? Let’s analyze the charts of the top 10 cryptocurrencies to find out.
S&P 500 Index price prediction
The S&P 500 Index (SPX) rose to a new all-time high on Thursday but witnessed profit booking at higher levels.
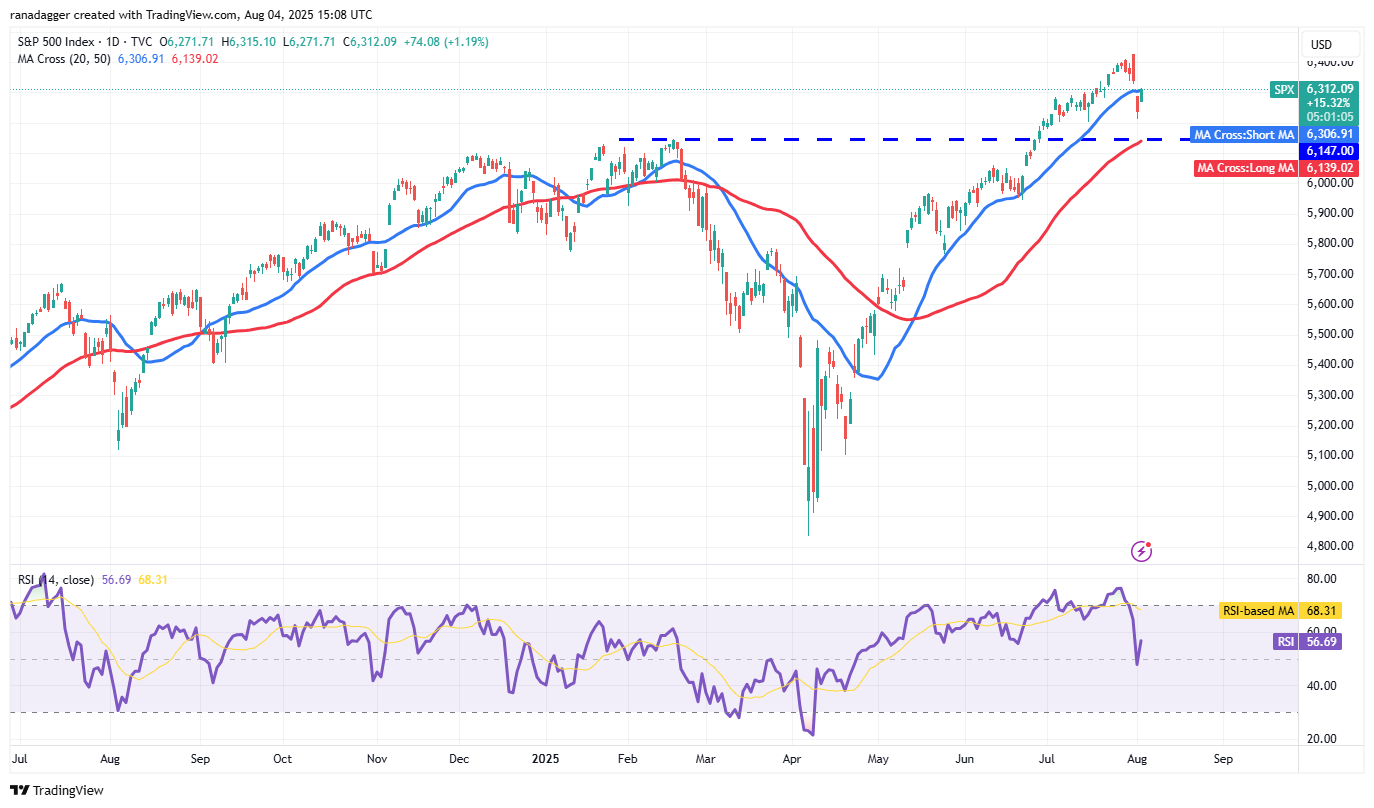
Selling continued on Friday, pulling the price below the 20-day simple moving average (6,306). The bulls are trying to get back into the driver’s seat by pushing the price back above the 20-day SMA on Monday. If they succeed, the index could retest the all-time high of 6,427.
Contrarily, if the price turns down from the 20-day SMA, it suggests that the rallies are being sold into. The index could then descend to the 50-day SMA (6,139), which is likely to attract buyers.
US Dollar Index price prediction
The US Dollar Index (DXY) broke above the 50-day SMA (98.29) on July 28 but turned down from the overhead resistance of 100.54 on Friday.
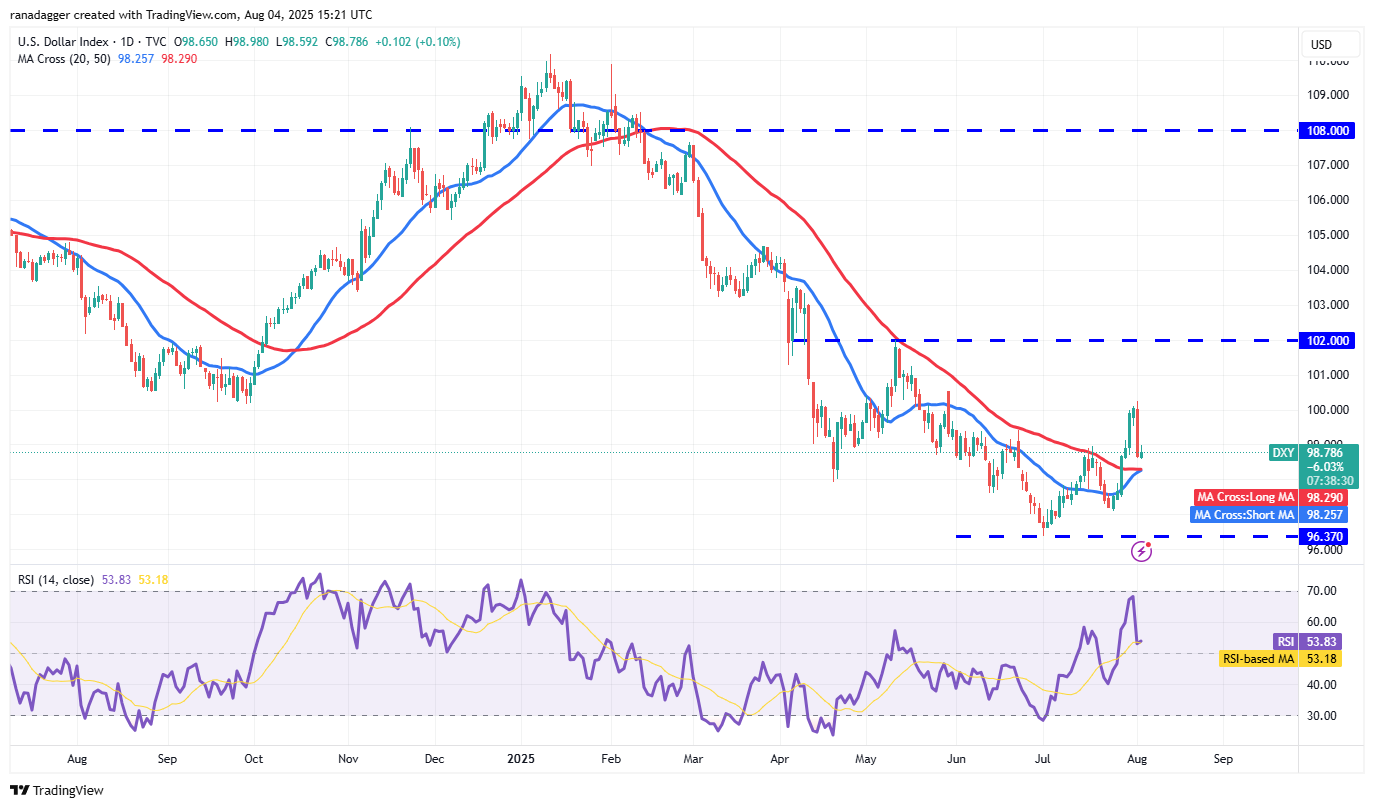
The bulls are trying to arrest the pullback near the moving averages, indicating that the selling pressure is reducing. If the price turns up from the current level and breaks above 100.54, the recovery could reach…
Click Here to Read the Full Original Article at Cointelegraph.com News…