Key points:
-
Bitcoin is facing selling near $120,000, but the bears have failed to pull the price below $115,000, indicating that buyers remain in command.
-
Select major altcoins continue to charge higher, signaling the arrival of an altseason
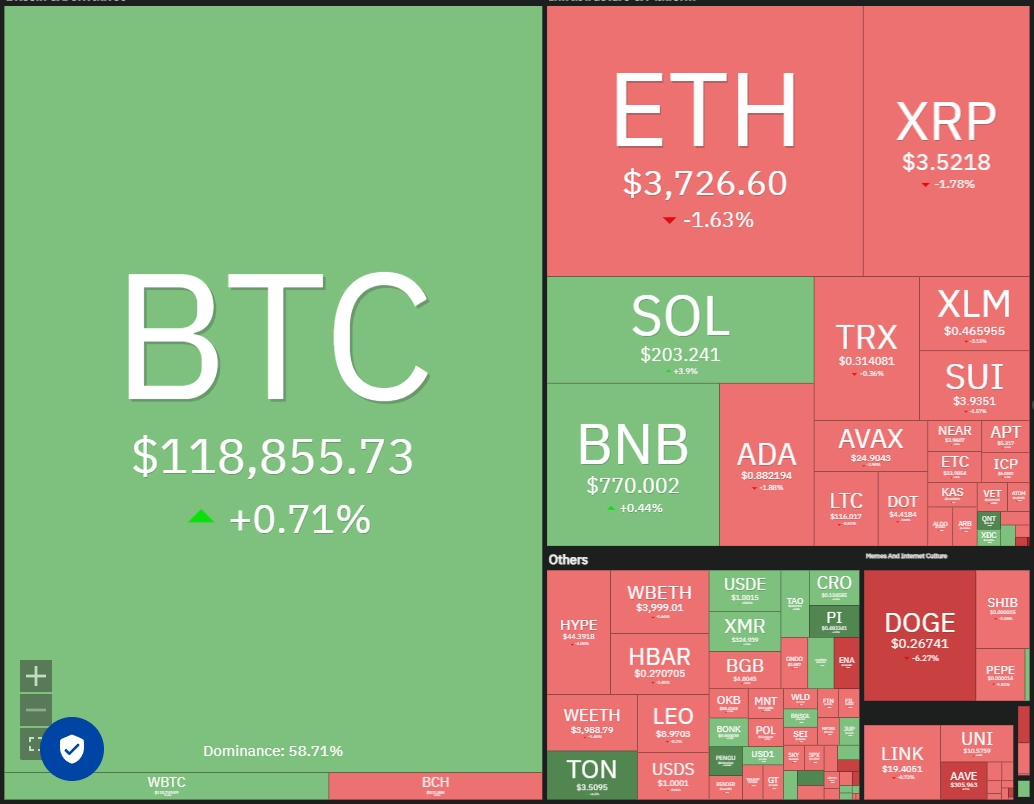
Bitcoin (BTC) continues to face selling near $120,000, but a positive sign is that the bulls have not allowed the price to dip below $115,000 in the past few days. That suggests the bulls are buying every minor dip and have kept up the pressure.
The spot BTC exchange-traded funds registered a net outflow of $131.35 million on Monday, but that comes after 12 consecutive days of about $6.6 billion in inflows, according to SoSoValue data. That indicates the buyers are not hurrying to book profits as they anticipate the up move to continue.
It’s not only BTC that is attracting buyers. CoinShares reported on Monday that Ether (ETH) exchange-traded products recorded $2.12 billion in inflows, roughly double its previous $1.2 billion record.
Will BTC break out of the overhead resistance and resume its uptrend? Could altcoins continue moving higher? Let’s analyze the charts of the top 10 cryptocurrencies to find out.
S&P 500 Index price prediction
The S&P 500 Index (SPX) turned up from the 20-day exponential moving average (6,218) on Wednesday, indicating buying on dips.
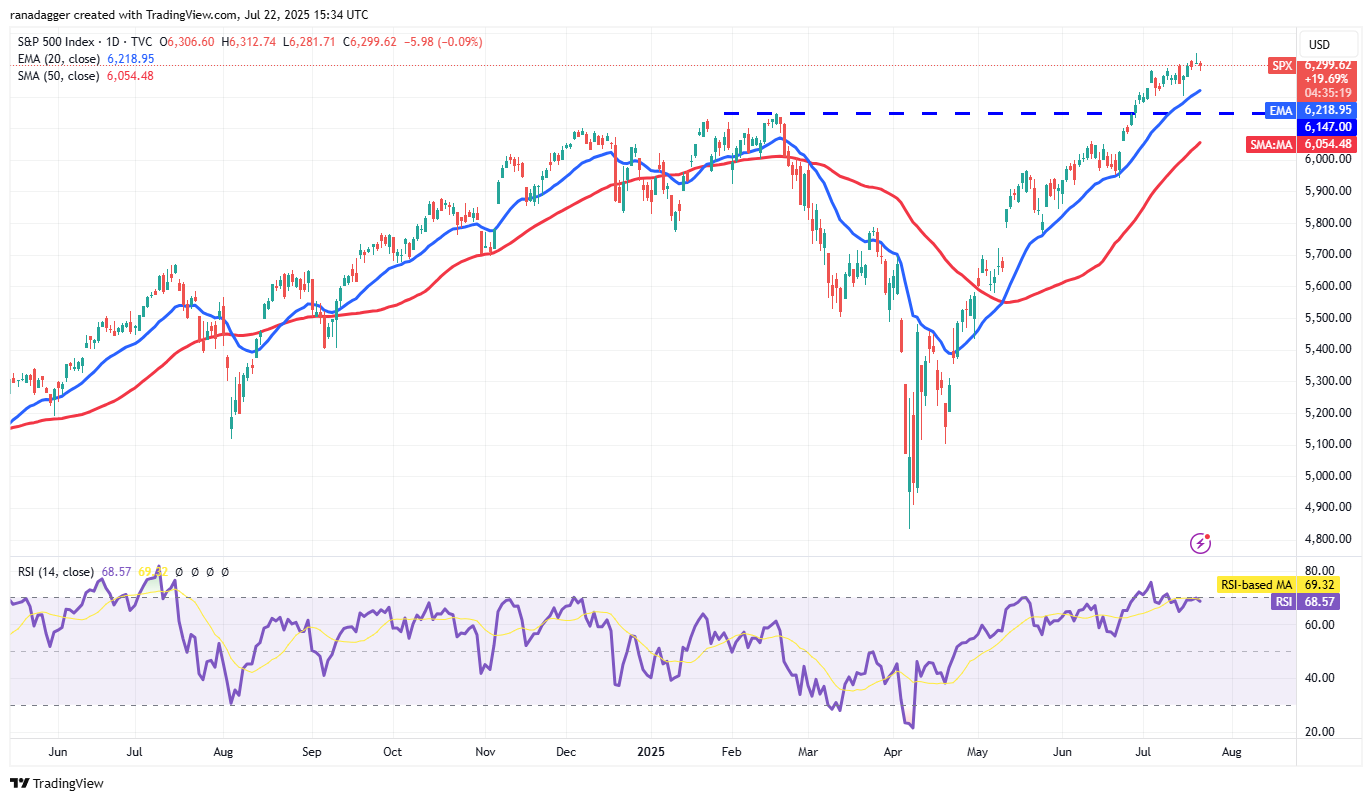
The upsloping moving averages and the relative strength index (RSI) near the overbought zone indicate that bulls remain in control. Buyers will try to push the price toward 6,500, which is likely to offer stiff resistance.
Sellers will have to pull the price below the 6,147 support to weaken the bullish momentum. The index could then slide to the 50-day simple moving average (6,054), which is a critical support to watch out for. A break below the 50-day SMA suggests the index may have topped out in the near term.
US Dollar Index price prediction
The recovery in the US Dollar Index (DXY) stalled at the 50-day SMA ($98.56), indicating selling on rallies.
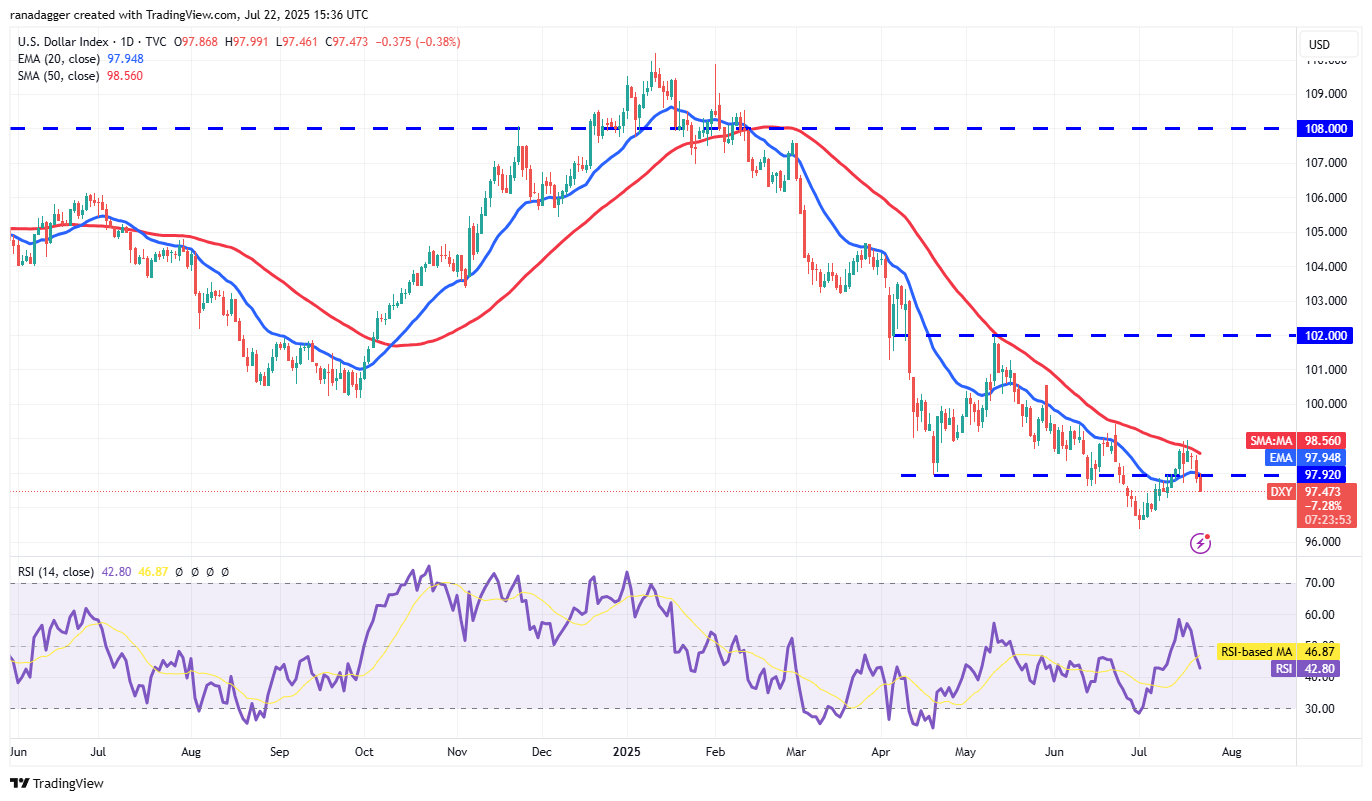
The bears have strengthened their position by pulling the price below the 20-day EMA ($97.94). That clears the path for a fall to 97.17 and then to the critical 96.37 level.
This negative view will be invalidated in the near term if the price turns up sharply and breaks above the 50-day SMA. That suggests the formation of a higher low and enhances the prospects of a rally…
Click Here to Read the Full Original Article at Cointelegraph.com News…