
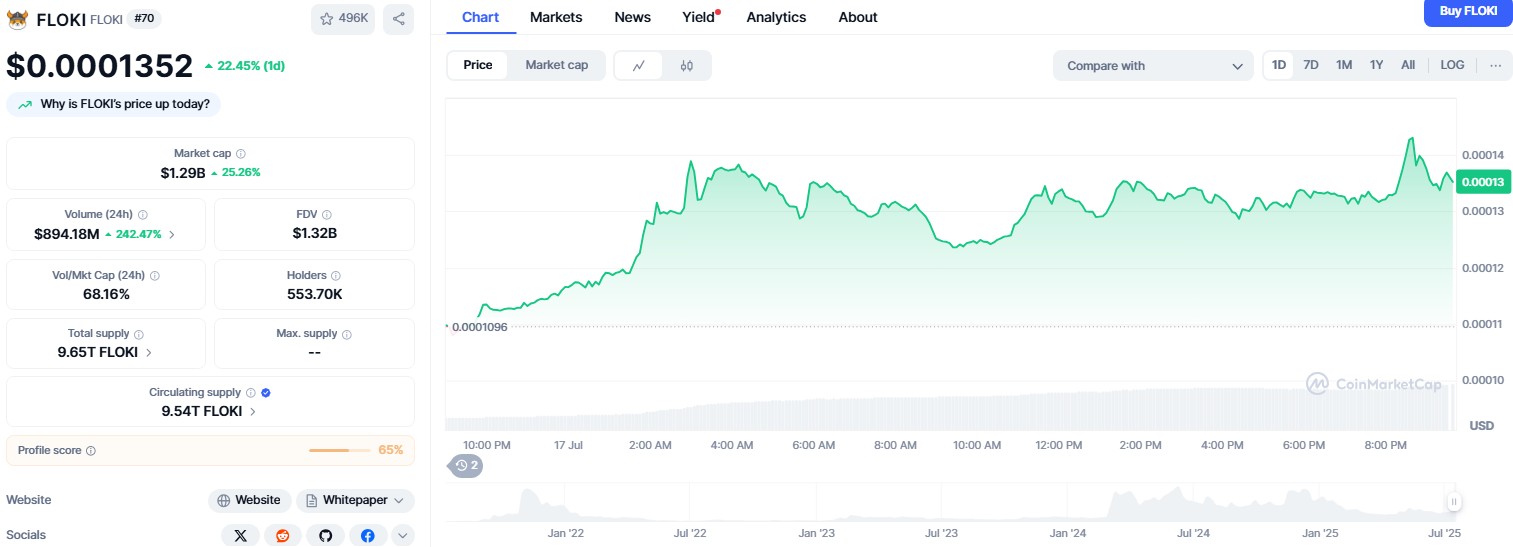
- FLOKI surged 40% in 24 hours to $0.0001352, backed by a rare triple EMA bullish crossover and steady on-chain holding behavior.
- Technical indicators point to a potential move toward $0.000164, with Fibonacci levels confirming bullish momentum.
- Long-term holders aren’t selling into the rally, lowering supply pressure and reinforcing market confidence.
FLOKI has recorded a sharp 40% price increase in 24 hours, pushing its value to $0.0001352 at the time of writing. On-chain and technical indicators suggest this surge may not be short-lived.
With a rare triple EMA bullish crossover confirmed and the Age Consumed metric signalling continued holding behaviour, the memecoin appears poised to test the $0.000164 level—a 25% rise from its current price—if current momentum holds.
Key support and resistance zones derived from Fibonacci extensions are also in play, suggesting a decisive phase for FLOKI’s near-term trajectory.
Despite the price uptick, long-held FLOKI tokens are not being redistributed.
The last notable movement of dormant coins occurred in early July when the Age Consumed value surged to approximately 62 trillion, a sign often associated with redistribution.
In contrast, the current trend has seen that indicator stay muted, implying that larger holders are refraining from selling into the rally.
This absence of sell-side activity from long-term holders has lowered the supply pressure, creating room for upward price movement.
This trend also suggests that market confidence is rising. A spike in the Age Consumed metric would normally precede a potential correction, as older tokens re-enter circulation.
Rare triple EMA crossover confirms bullish trend
FLOKI’s current rally gained traction around 10 July, when a significant technical pattern began to form.
On that date, the 20-day exponential moving average (EMA) crossed above the 50-day EMA.
Two days later, the 20-day EMA rose above the 100-day EMA, and by 16 July, the 50-day EMA also overtook the 100-day EMA.
This alignment of moving averages forms a rare technical formation known as a Triple EMA Bullish Crossover.
Such a formation is typically interpreted as a strong bullish signal, particularly when all three key EMAs line up in ascending order.
It reflects consistent…