Key takeaways:
-
LTC’s spot cumulative volume delta flipped positive for the first time since December 2024, signaling a positive shift in market sentiment.
-
A potential LTC ETF could trigger institutional investor demand and align with its historically strong Q4 performance.
Litecoin (LTC) has slipped below the $90 mark, and while the price action may appear weak, several fundamental and onchain indicators suggest the tide could soon turn in favor of the bulls.
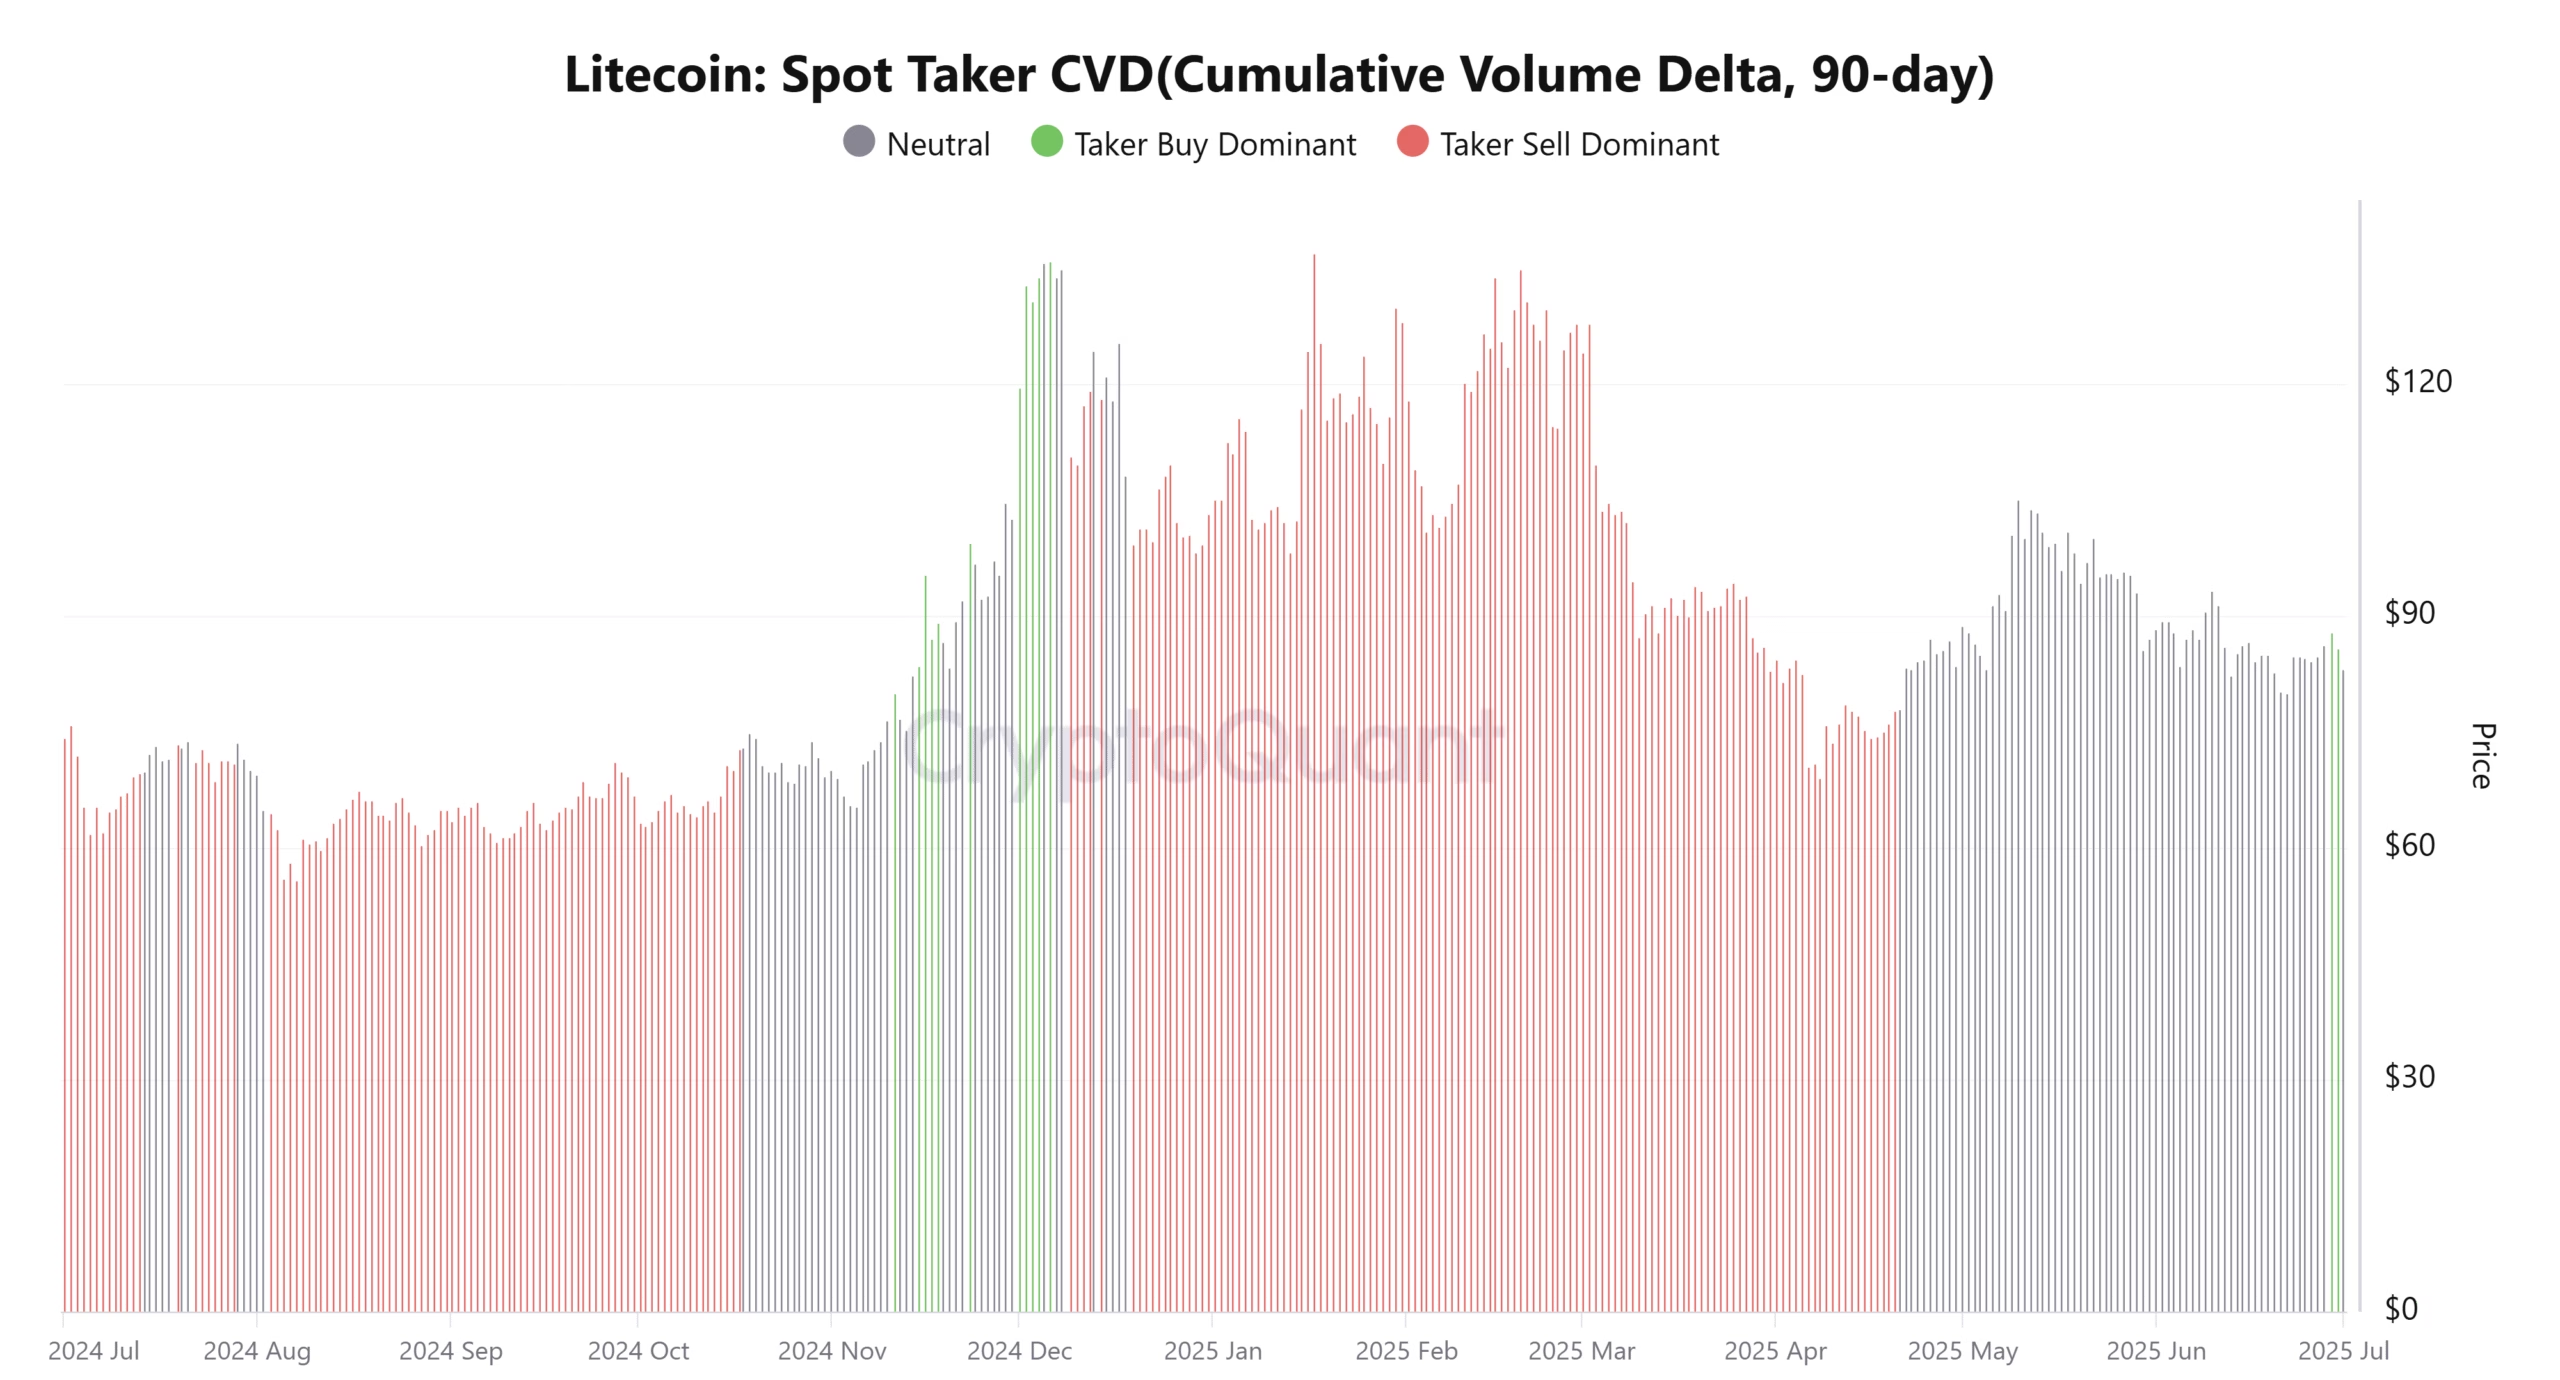
One bullish trend shift can be identified from the 90-day Spot Cumulative Volume Delta (CVD), which gauges the balance between market buy and sell pressure. After remaining negative and at times neutral since December 2024, the Spot CVD flipped positive on Saturday. This shift signals a return to a “taker buy dominant” phase, suggesting that market participants are stepping in to buy LTC at current prices.
The positive sentiment around a potential LTC exchange-traded fund (ETF) could be fueling the bullish case. Cointelegraph reported that Bloomberg’s ETF analysts believe there’s a 95% chance that an LTC ETF, alongside SOL and XRP ETFs, could receive SEC approval by Oct. 2. A successful approval would be a historic milestone for the altcoin, possibly unlocking institutional investors and broader retail exposure.
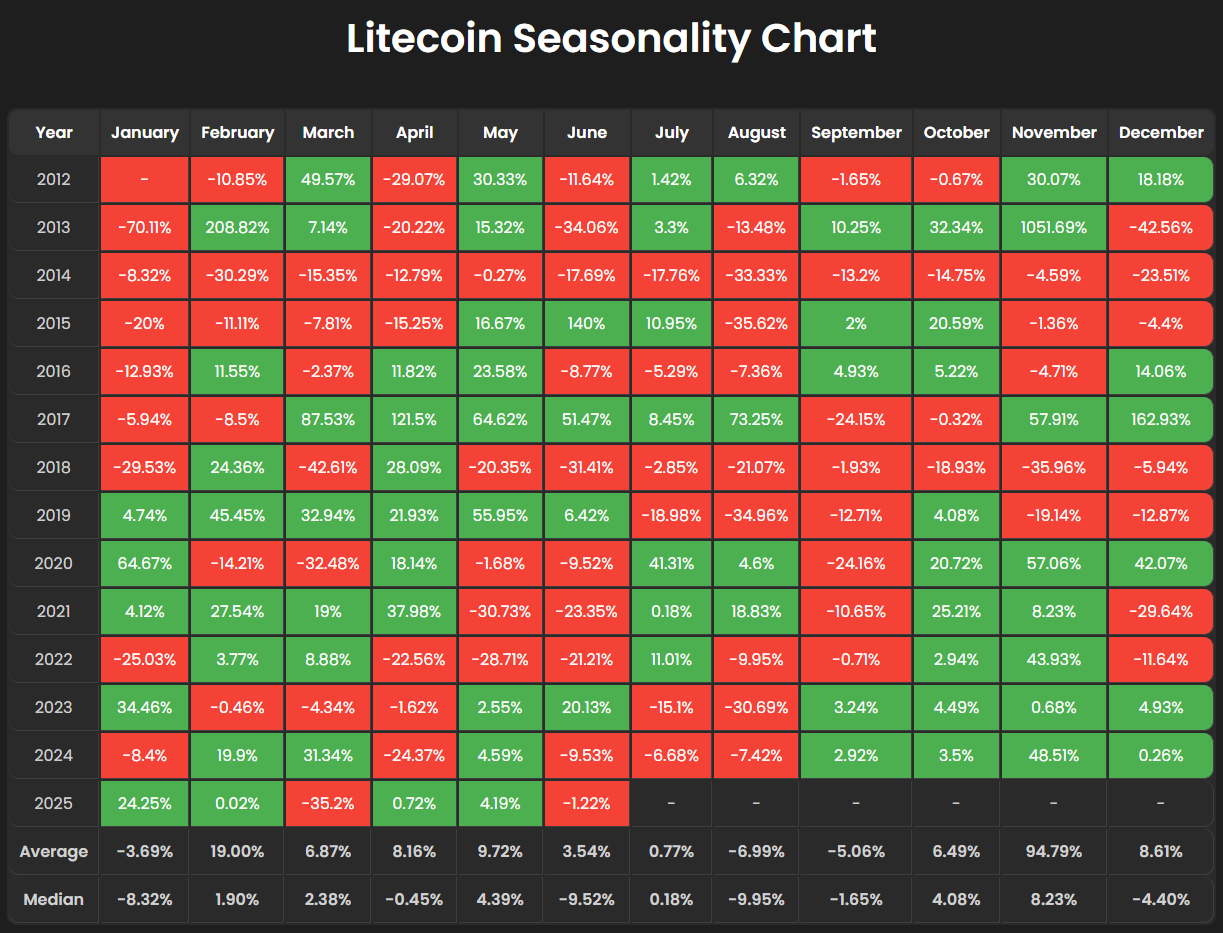
However, seasonality might dampen short-term expectations. Data shows that August and September are historically the weakest months for LTC, posting negative returns of 6.99% and 5.06% on average since 2012. However, this is typically followed by a significant turnaround in the Q4, with November being the best-performing month historically for LTC with 94.79% returns on average.

If approval is granted, the ETF decision coincides with the seasonal pivot in LTC’s performance, setting the stage for a potential rally. Combined with the ongoing shift in onchain buyer behavior, current price weakness may be less of a warning sign and more of a strategic accumulation zone.
Related: SOL ETF news gain evaporates, while chart warns of another 20% drop
LTC daily chart echoes of 2024 Setup
LTC’s current price structure is mirroring its 2024 trajectory. After a strong Q1 rally earlier this year, LTC entered a correction phase and remained suppressed below a descending trend line throughout Q2.
The price has retested a high-conviction daily demand zone (highlighted in orange), which previously acted as a base for a…
Click Here to Read the Full Original Article at Cointelegraph.com News…
