Key points:
-
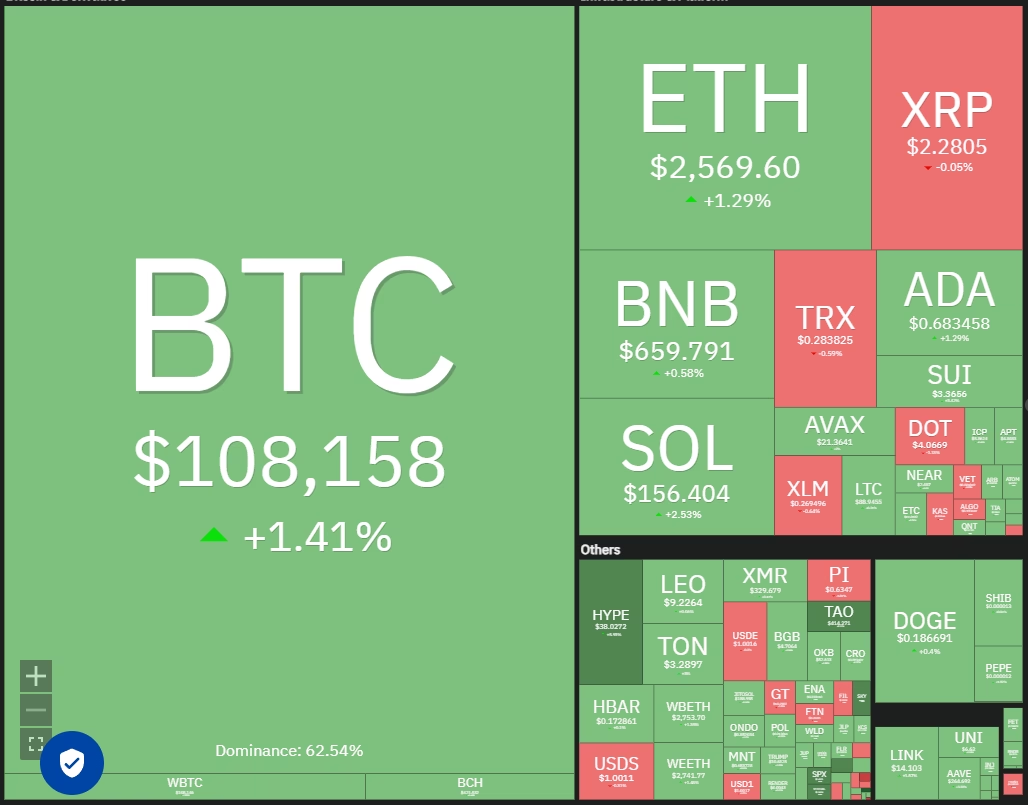
Bitcoin opened the week with strength as bulls target new highs in BTC and altcoins.
-
Many major altcoins are stuck in a range, but HYPE is showing signs of strength.
Bitcoin (BTC) made a solid start to the week, sprinting toward the overhead resistance zone of $109,588 to $111,980. The move higher may have been triggered due to the optimistic expectations from the US-China trade talks in London.
Trader Cas Abbe said in a post on X that Bitcoin is likely to witness a big move, possibly above $109,000 to $110,000. Abbe noted that $15.11 billion in shorts would be liquidated if Bitcoin soars 10% from the current levels. On the other hand, a 10% down move risks liquidation of $9.58 billion in long positions.
Although most analysts believe Bitcoin’s long-term trajectory is up, some anticipate a short-term dip before the uptrend resumes. Private wealth manager Swissblock anticipates a drop to $104,000, while analyst Mickybull Crypto expects a fall to $101,500.
Could buyers propel Bitcoin above the all-time high of $111,980, pulling altcoins higher? Let’s analyze the charts of the top 10 cryptocurrencies to find out.
S&P 500 Index price prediction
The S&P 500 Index (SPX) extended its recovery last week, and the bulls are trying to build upon the momentum on June 9.
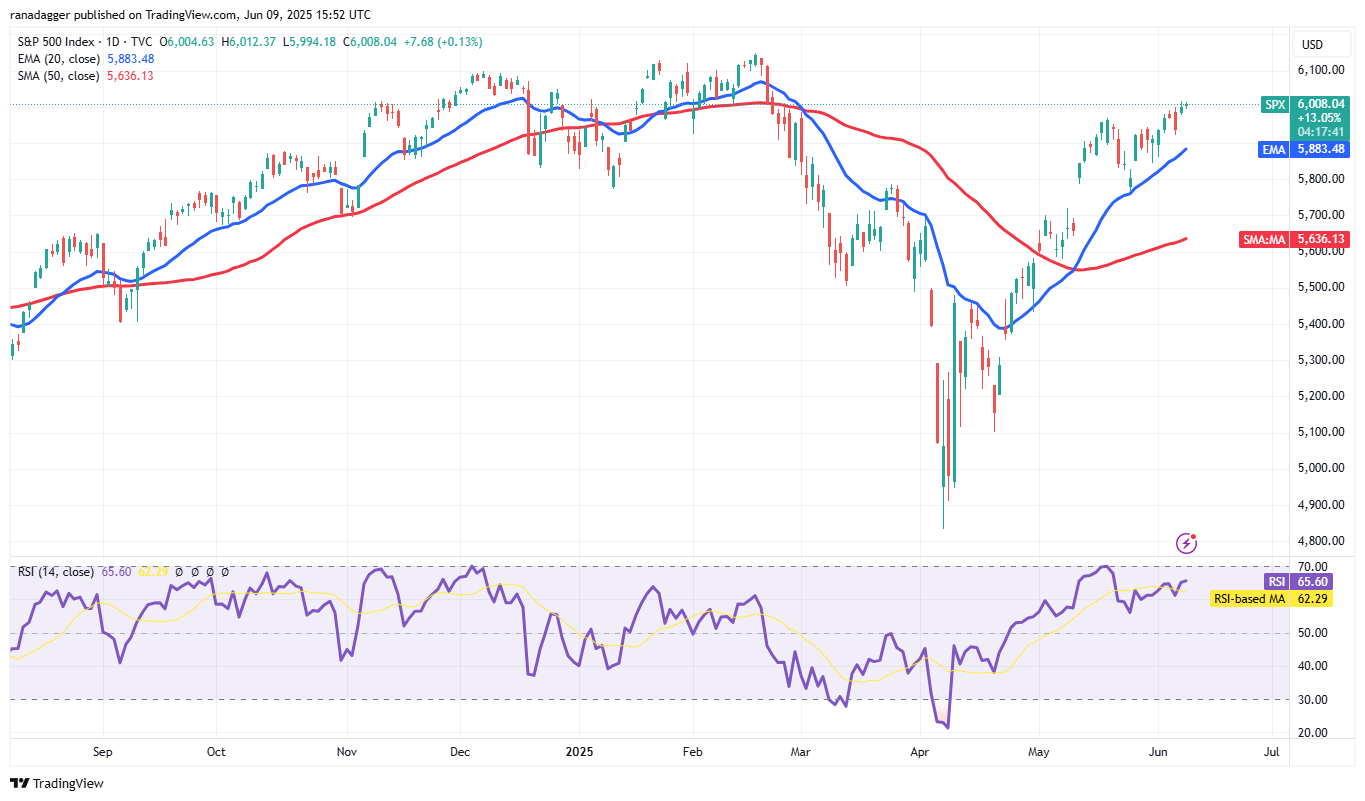
The upsloping 20-day exponential moving average (EMA) (5,883) and the relative strength index (RSI) in the positive territory indicate that the bulls are in command. Buyers will try to push the price to the 6,147 overhead resistance.
The move higher may not be easy as the sellers are expected to defend the 6,000 to 6,147 zone with all their might. The first sign of weakness will be a break and close below the 20-day EMA, opening the gates for a fall to 5,767.
US Dollar Index price prediction
Buyers are trying to start a recovery in the US Dollar Index (DXY) but are facing selling near the 20-day EMA (99.49).
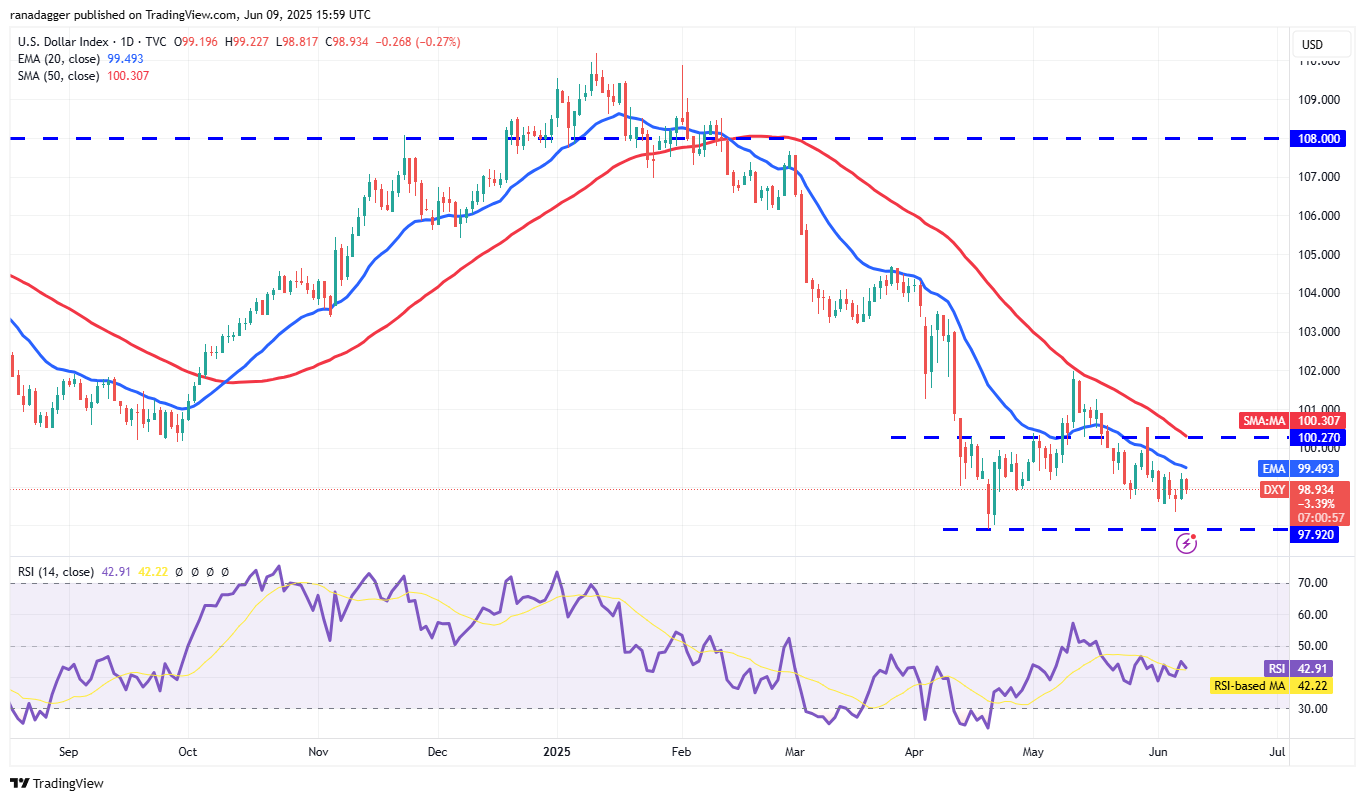
The bears will try to sink the index to 97.92, an important support level to watch out for. A break and close below the 97.92 level signals the resumption of the downtrend. The index could then extend the decline to 95.67.
This negative view will be invalidated in the near term if the price turns up and breaks above the 50-day simple moving average (SMA) (100.30). The index could then jump to the overhead resistance at 102.
Bitcoin price…
Click Here to Read the Full Original Article at Cointelegraph.com News…