Bitcoin (BTC) is moving farther away from the crucial $90,000 mark, indicating that buying dries up at higher levels. Market participants seem nervous about the fresh round of US trade tariffs and the renewed inflation pressure as US Personal Consumption Expenditures data came in hotter-than-expected.
Traders are divided about Bitcoin’s price trajectory in 2025. Analyzing data from the prediction markets platform Polymarket, X user Ashwin highlighted that Bitcoin’s most bearish target for 2025 is $59,040, and the most bullish is $138,617.
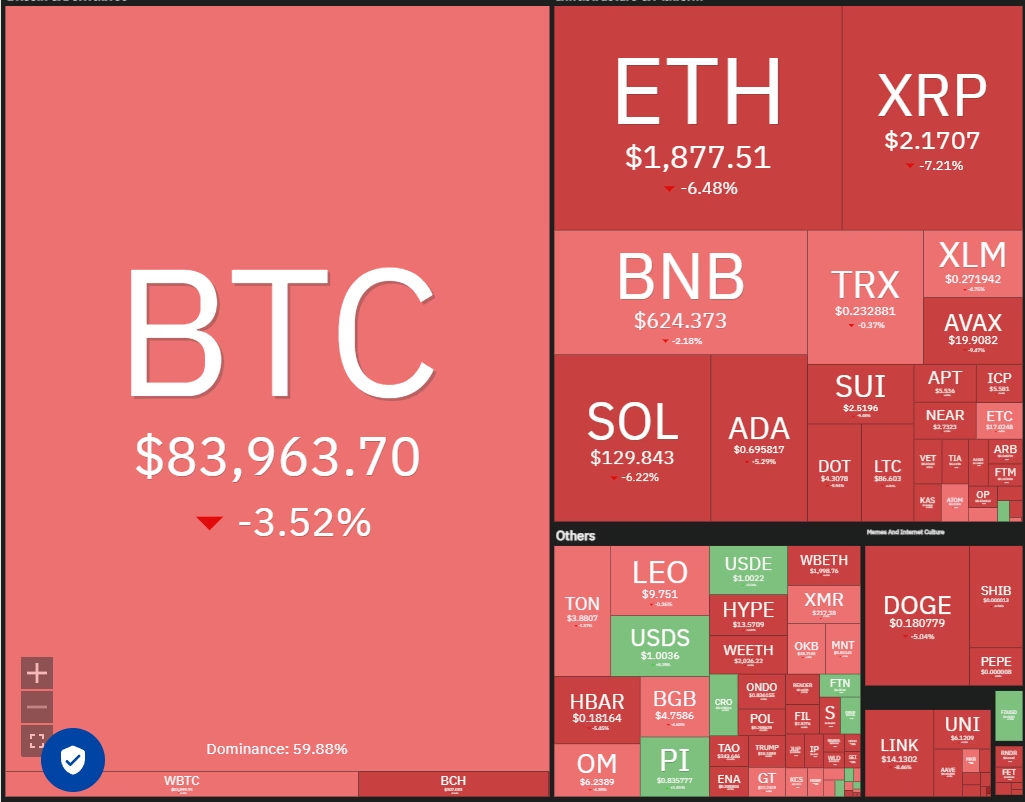
Crypto market data daily view. Source: Coin360
Although the near-term remains uncertain, Real Vision chief crypto analyst Jamie Coutts remains bullish on Bitcoin. Coutts told Cointelegraph that Bitcoin could hit a new all-time high above $109,000 before the end of the second quarter. He added that a lack of clarity on the US tariffs and recession concerns are unlikely to derail the potential Bitcoin rally.
What are the important support levels to watch out for in Bitcoin and the major altcoins? Let’s analyze the charts of the top 10 cryptocurrencies to find out.
Bitcoin price analysis
Bitcoin turned down from the resistance line and broke below the 20-day exponential moving average ($85,765) on March 28.
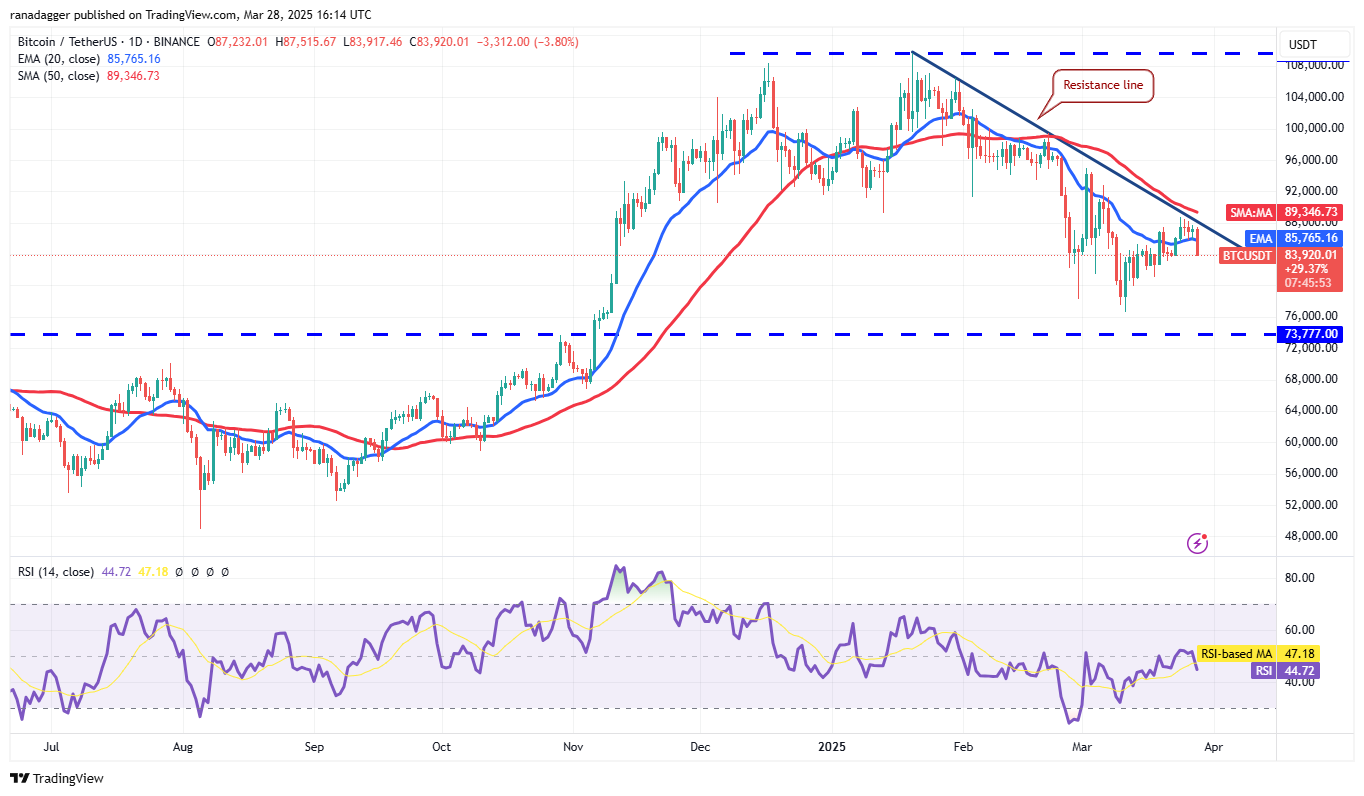
BTC/USDT daily chart. Source: Cointelegraph/TradingView
The bears will try to pull the price below the immediate support at $83,000. If they do that, the BTC/USDT pair could slide to $81,000 and later to $80,000. Buyers are expected to fiercely defend the zone between $76,606 and $80,000.
The bulls will have to push and maintain the price above the resistance line to signal that the correction may be ending. A close above the 50-day simple moving average ($89,346) could propel the pair to $95,000 and eventually to the psychological resistance at $100,000.
Ether price analysis
Ether (ETH) turned down from the breakdown level of $2,111 and broke below the 20-day EMA ($2,032), indicating that the bears remain in control.
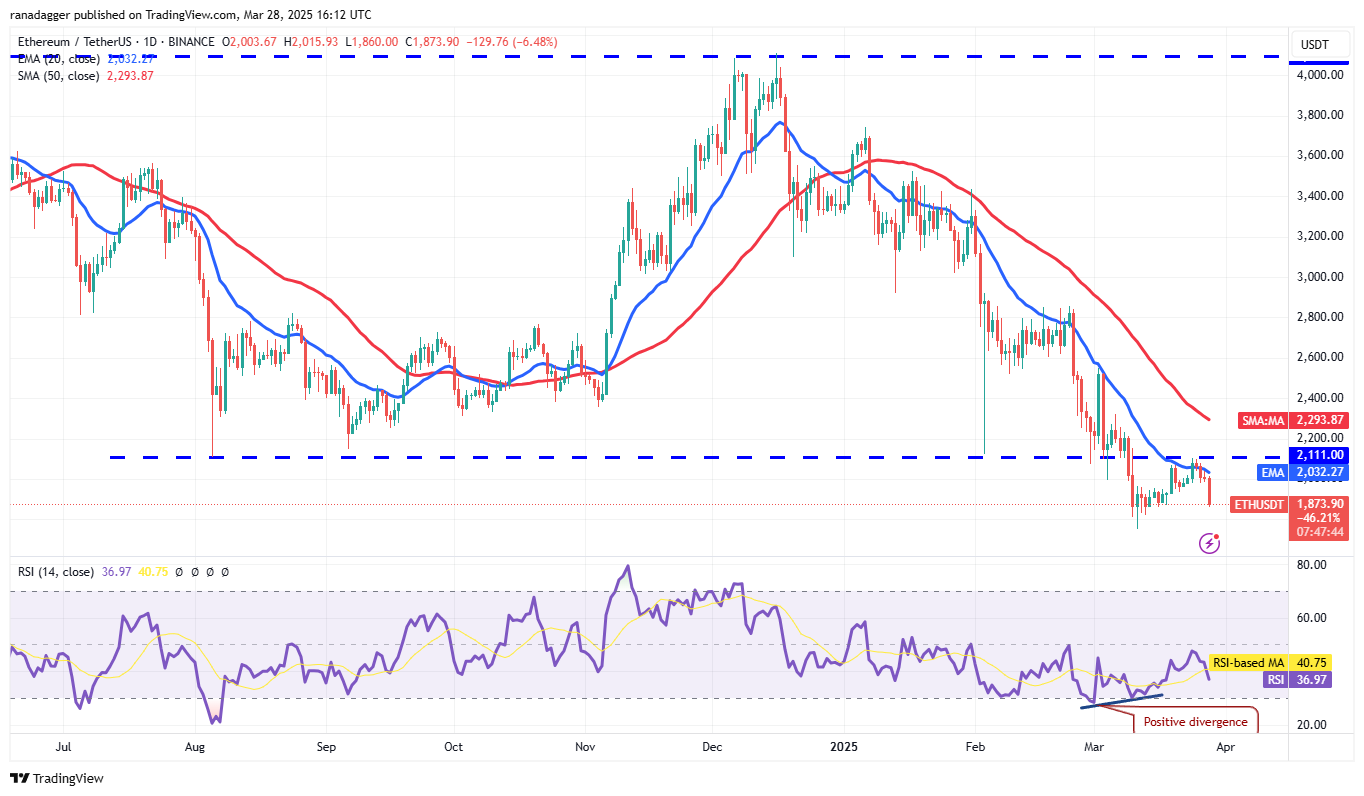
ETH/USDT daily chart. Source: Cointelegraph/TradingView
Sellers will try to sink the ETH/USDT pair to the $1,800 to $1,754 support zone. Buyers are expected to vigorously defend the zone because a break below it could resume the downtrend. The next stop on the downside could be $1,550.
Buyers will have to push and sustain the price above $2,111 to signal that the bearish momentum is weakening. The 50-day SMA ($2,293) may act as a hurdle on the upside, but if taken out, the pair could rally to $2,550.
XRP price…
Click Here to Read the Full Original Article at Cointelegraph.com News…