

Bitcoin (BTC) bulls have maintained the pressure and are attempting to push the price above the $90,000 resistance. A positive sign in favor of the bulls is that the US spot Bitcoin exchange-traded funds have witnessed net inflows for eight successive trading days, according to SoSoValue data. That indicates institutional investors are gradually buying again.
In another positive, a Bitcoin whale bought 2,400 Bitcoin — worth over $200 million — on March 24 to increase the total holding to more than 15,000 BTC, blockchain analytics firm Arkham Intelligence said in a post on X.
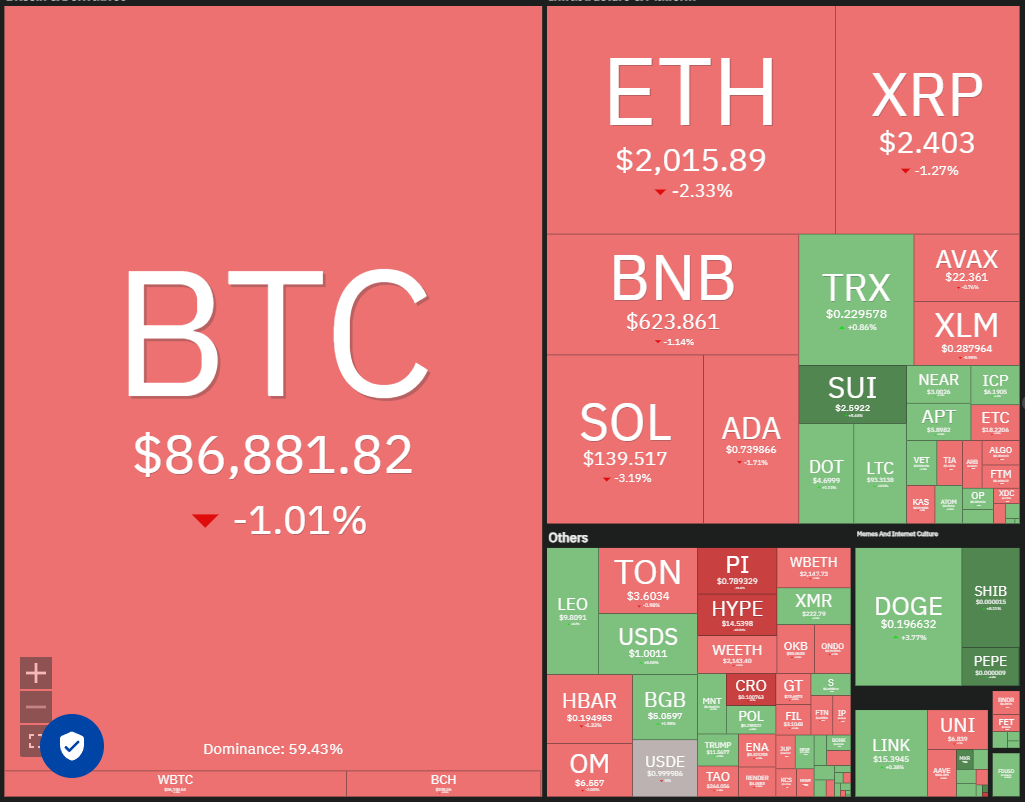
Crypto market data daily view. Source: Coin360
However, a Bitcoin rally may not be easy as bulls are expected to encounter solid selling near $90,000. Alphractal CEO Joao Wedson highlighted in a post on X that whales had closed long positions and initiated short positions on Bitcoin at $88,000. He added that history says the whales are right.
Could Bitcoin break above the stiff overhead resistance, pulling altcoins higher, or is it time for a short-term correction? Let’s analyze the charts of the top 10 cryptocurrencies to find out.
Bitcoin price analysis
Bitcoin is facing selling at the resistance line, but a positive sign is that the bulls have not allowed the price to dip below the 20-day exponential moving average ($85,825).
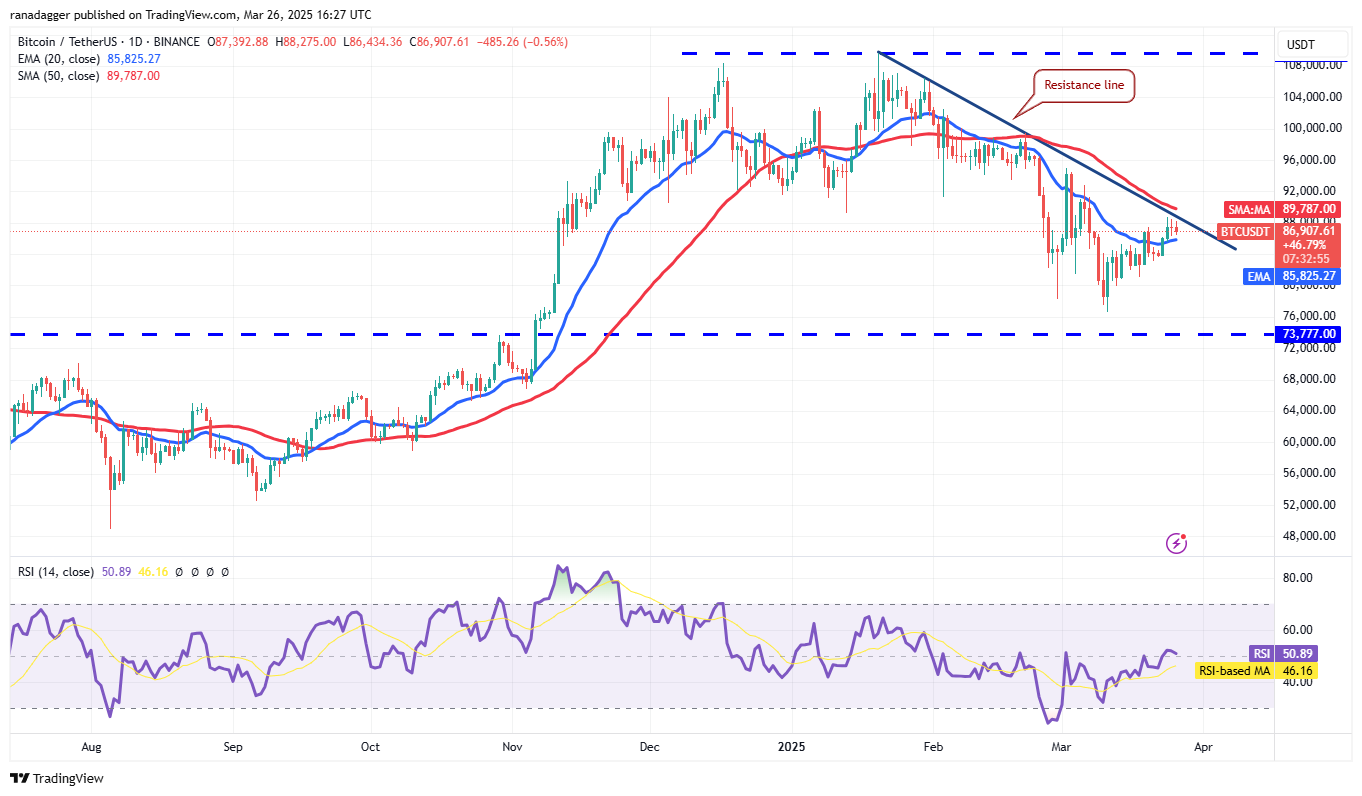
BTC/USDT daily chart. Source: Cointelegraph/TradingView
The flattening 20-day EMA and the relative strength index (RSI) near the midpoint suggest that the bulls have a slight edge. A break and close above the 50-day simple moving average ($89,787) indicates that the correction may be over. The BTC/USDT pair could soar to $95,000 and later to the crucial resistance at $100,000.
Contrary to this assumption, if the price turns down and breaks below the 20-day EMA, it signals that the bulls have given up. That may sink the pair to $83,000 and then to $80,000.
Ether price analysis
Ether’s (ETH) recovery is facing solid resistance at the breakdown level of $2,111, indicating that the bears are unwilling to give up their advantage.
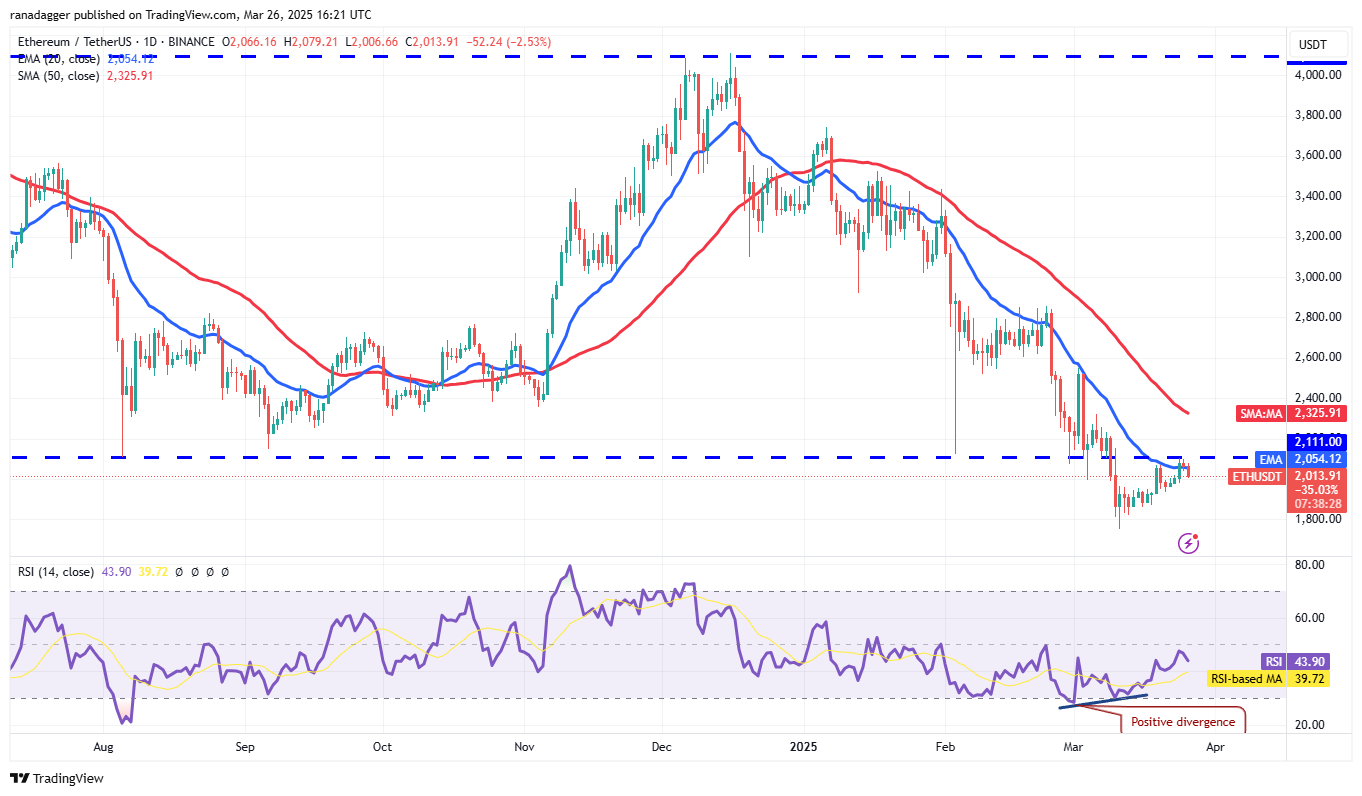
ETH/USDT daily chart. Source: Cointelegraph/TradingView
If the price continues lower and breaks below $1,937, it will signal that the bears are trying to flip the $2,111 level into resistance. If that happens, the ETH/USDT pair could decline to $1,800.
This negative view will be invalidated in the near term if the price turns up and breaks above $2,111. That opens the doors for a rally to the 50-day SMA ($2,325) and subsequently to $2,550. Such a…
Click Here to Read the Full Original Article at Cointelegraph.com News…