

Bitcoin (BTC) has been clinging to the 200-day simple moving average ($84,359), which suggests that the bulls have kept up the pressure. That improves the prospects of an upside breakout, signaling the corrective phase may be ending.
Derive founder Nick Forster told Cointelegraph that the current pullback is a normal correction that Bitcoin experiences during long-term rallies. He anticipates that Bitcoin’s cycle peak is yet to come.
A positive sign in favor of bulls is that the US spot Bitcoin exchange-traded funds (ETFs) have again started to witness inflows. According to Farside Investors data, spot Bitcoin ETFs have recorded $525 million in inflows since March 14.

Crypto market data daily view. Source: Coin360
However, not everyone is bullish on Bitcoin. CryptoQuant founder and CEO Ki Young Ju said in a post on X that Bitcoin could remain in a bearish or sideways trend for the next 6-12 months as the bull cycle is over.
Could Bitcoin break out of the 200-day SMA, triggering a rally in altcoins? Let’s analyze the charts of the top 10 cryptocurrencies to find out.
Bitcoin price analysis
Bitcoin is facing selling at the 200-day SMA, but the bulls have not given up much ground. That suggests the bulls are not dumping their positions as they expect a breakout in the near term.
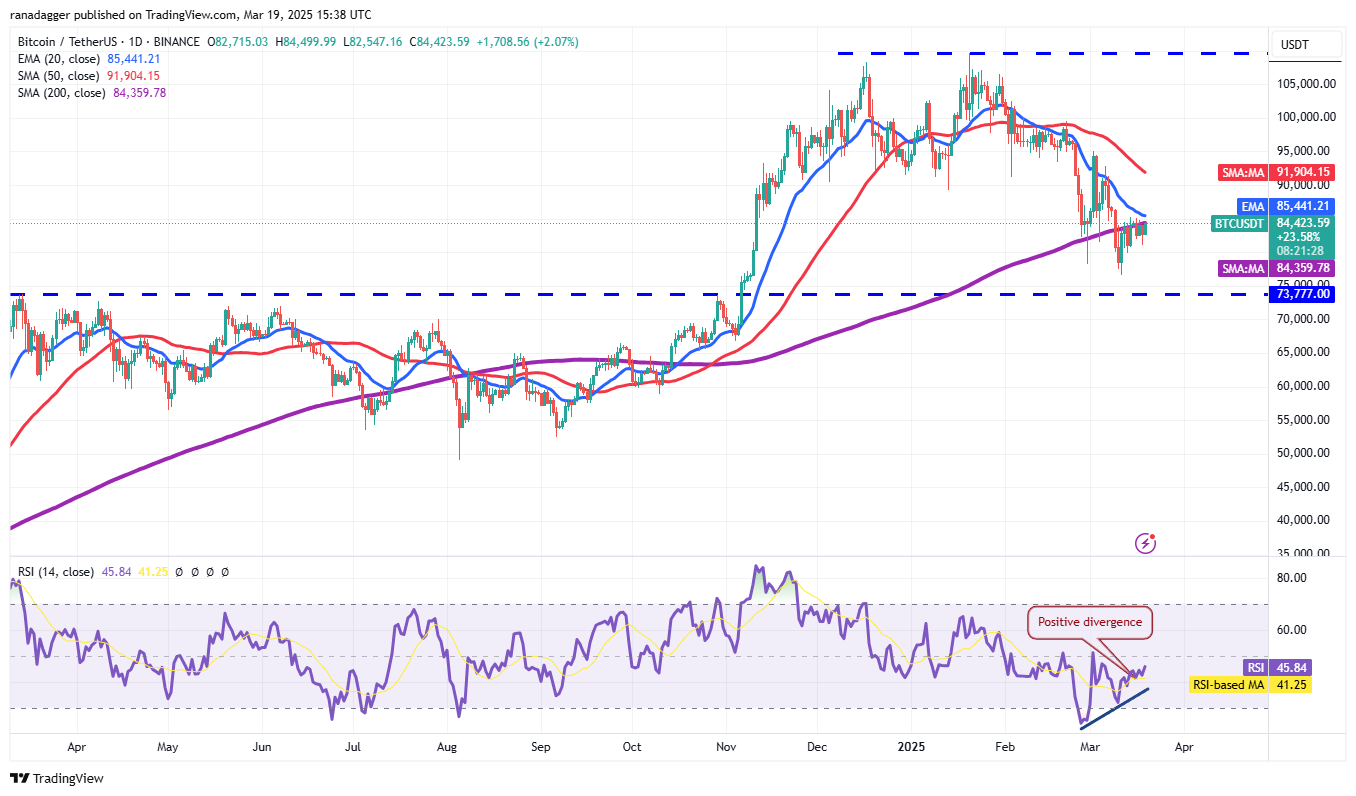
BTC/USDT daily chart. Source: Cointelegraph/TradingView
The bullish momentum is expected to pick up on a break and close above the 20-day exponential moving average ($85,441). The BTC/USDT pair could then climb to the 50-day SMA ($91,904).
This optimistic view will be negated in the near term if the price turns down sharply from the 20-day EMA and breaks below $80,000. The pair may then tumble to $76,606. Buyers are expected to defend the $76,606 to $73,777 zone with all their might.
Ether price analysis
The narrow range trading in Ether (ETH) resolved to the upside on March 19, indicating that the bulls have overpowered the bears.

ETH/USDT daily chart. Source: Cointelegraph/TradingView
Sellers will try to halt the relief rally at the breakdown level of $2,111, but if the bulls prevail, the ETH/USDT pair could ascend to the 50-day SMA ($2,468). If this level is also crossed, the pair could surge to $2,850.
Instead, if the price turns down sharply from $2,111, it will signal that the bears are trying to flip the level into resistance. The bears will gain the upper hand if they sink and maintain the price below $1,800.
XRP price analysis
XRP (XRP) surged above the moving averages on March 19,…
Click Here to Read the Full Original Article at Cointelegraph.com News…