Bitcoin (BTC) turned up from $81,500 on March 4, and the bulls are trying to extend the recovery above $90,000 on March 5. However, some analysts do not expect Bitcoin to run up in the near term. Bitfinex analysts said in a March 3 markets report that Bitcoin could face “significant resistance” at $94,000.
In another note of caution, CryptoQuant contributor XBTManager said in a Quicktake post that Bitcoin is likely to extend its consolidation for some time. Hence, risky trades should be avoided over the next few months. The analyst said the time to buy will come when short-term holders — those holding for under 155 days — start selling and the long-term holders start buying.
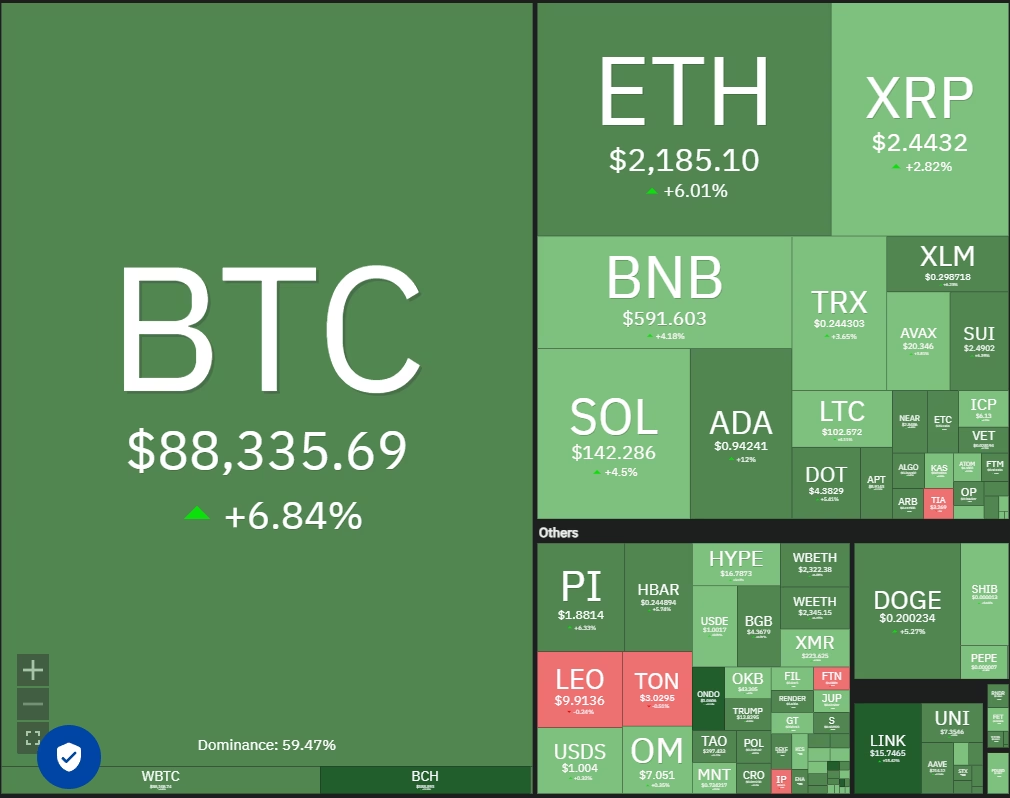
Crypto market data daily view. Source: Coin360
While the near-term price action remains uncertain, investors are confident about Bitcoin’s long-term prospects. Mexican billionaire Ricardo Salinas said in a Bloomberg interview that 70% of his investment portfolio is in Bitcoin-related assets, while the remaining 30% is made up of gold and gold miners.
What are the critical support and resistance levels in Bitcoin and altcoins? Let’s analyze the charts of the top 10 cryptocurrencies to find out.
Bitcoin price analysis
Bitcoin looks to be forming a symmetrical triangle pattern, indicating indecision between the buyers and sellers.

BTC/USDT daily chart. Source: Cointelegraph/TradingView
The BTC/USDT pair reached the 20-day exponential moving average ($91,174), which is an important resistance to watch out for. A break above the 20-day EMA suggests the selling pressure is reducing. The pair will then try to rise above the resistance line of the triangle and charge toward the 50-day simple moving average ($97,259). A break and close above the 50-day SMA signals that the bulls are back in the game.
This optimistic view will be negated in the near term if the price turns down sharply from the 20-day EMA and breaks below the triangle. That could result in a retest of the Feb. 28 intraday low of $78,258.
Ether price analysis
Ether (ETH) nosedived below $2,000 on March 4, but the bulls aggressively purchased at lower levels, as seen from the long tail on the candlestick.

ETH/USDT daily chart. Source: Cointelegraph/TradingView
Buyers have an uphill task ahead of them as the relief rally is likely to face solid resistance at the 20-day EMA ($2,467) and next at the downtrend line. If the price turns down from the overhead resistance, the bears will again try to sink and sustain the ETH/USDT…
Click Here to Read the Full Original Article at Cointelegraph.com News…