The United States equities markets welcomed the debt ceiling deal and the May nonfarm payrolls data on June 2 with strong rallies. The S&P 500 rose 1.8% during the week while the tech-heavy Nasdaq was up 2%. This was the sixth successive week of gains for the Nasdaq, the first such occasion since January 2020.
In addition to the above, the expectation of the Federal Reserve remaining in a pause mode during the next meeting may have acted as a catalyst for the rally. CME’s FedWatch Tool is showing a 75% probability of a pause, with the remaining 25% expecting a 25 basis points hike in the June 14 meeting.
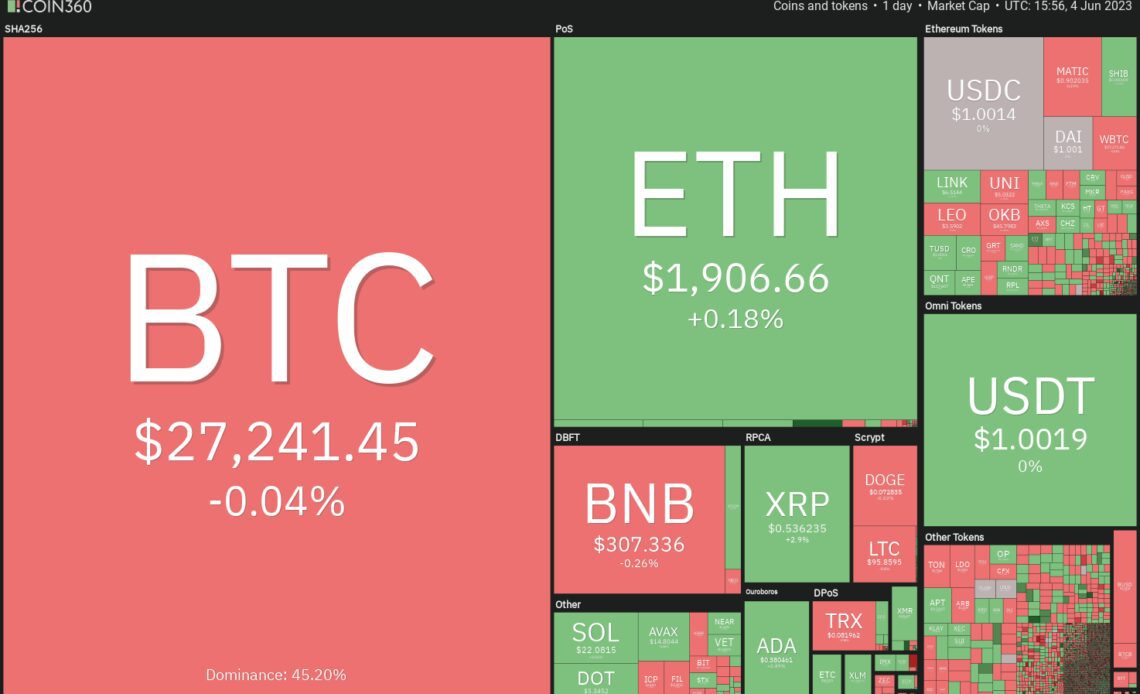
Rallies in the equities markets failed to trigger a similar performance in Bitcoin (BTC) and the altcoins. However, a minor positive is that several major cryptocurrencies have stopped falling and are trying to start a recovery.
Could bulls maintain the momentum and surmount the respective overhead resistance levels? If they do, which are the top five cryptocurrencies that may lead the rally?
Bitcoin price analysis
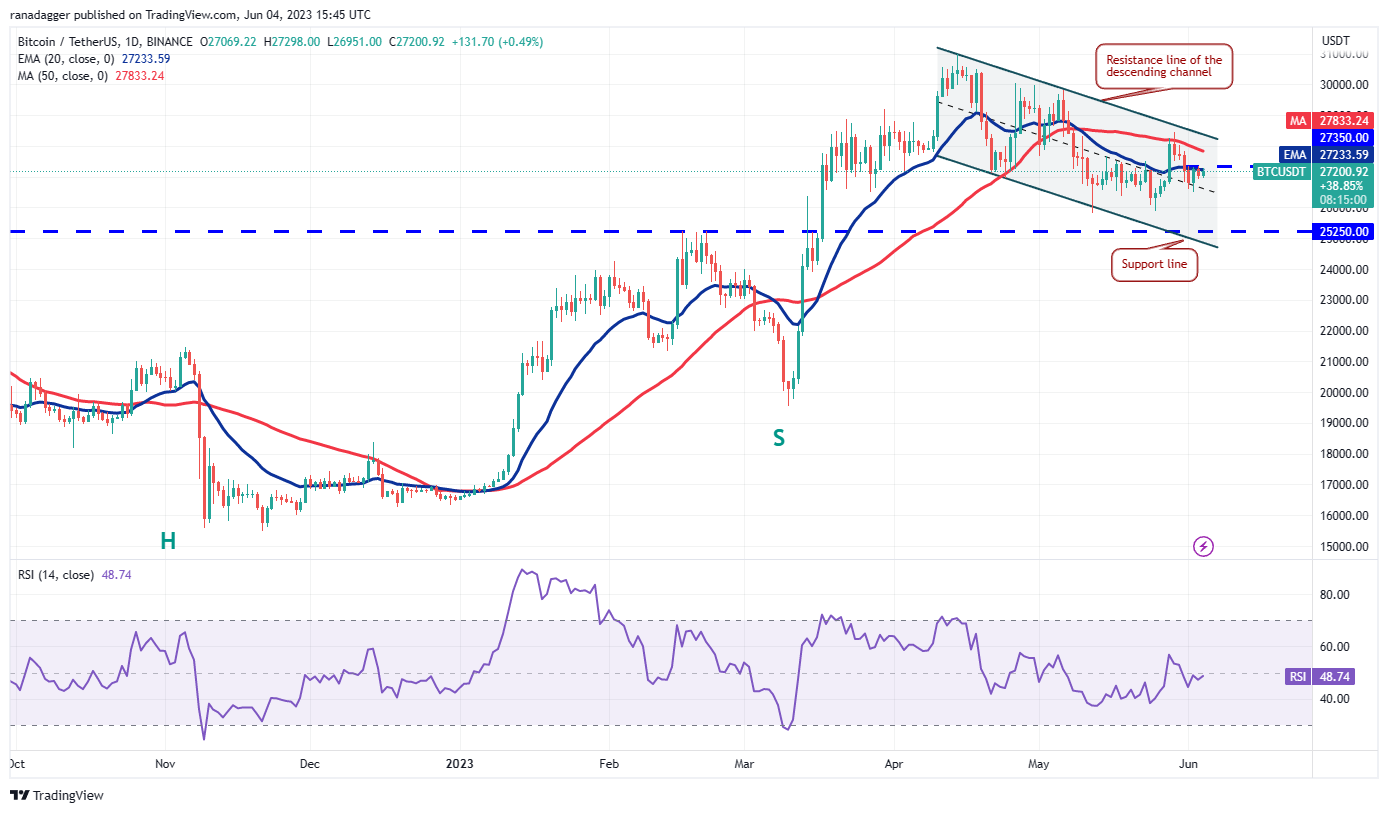
Bitcoin has been trading close to the 20-day exponential moving average ($27,233) for the past three days. This suggests that the bulls are buying the dip near $26,500.

The 20-day EMA has flattened out and the relative strength index (RSI) is just below the midpoint, indicating a balance between supply and demand. This balance will tilt in favor of the buyers if they drive the price above the resistance line of the descending channel pattern. That may start a northward march toward $31,000.
If the price turns down from the resistance line, it will suggest that the BTC/USDT pair may spend some more time inside the channel. The critical level to watch on the downside is $25,250. A break and close below this support may intensify selling and tug the price toward $20,000.

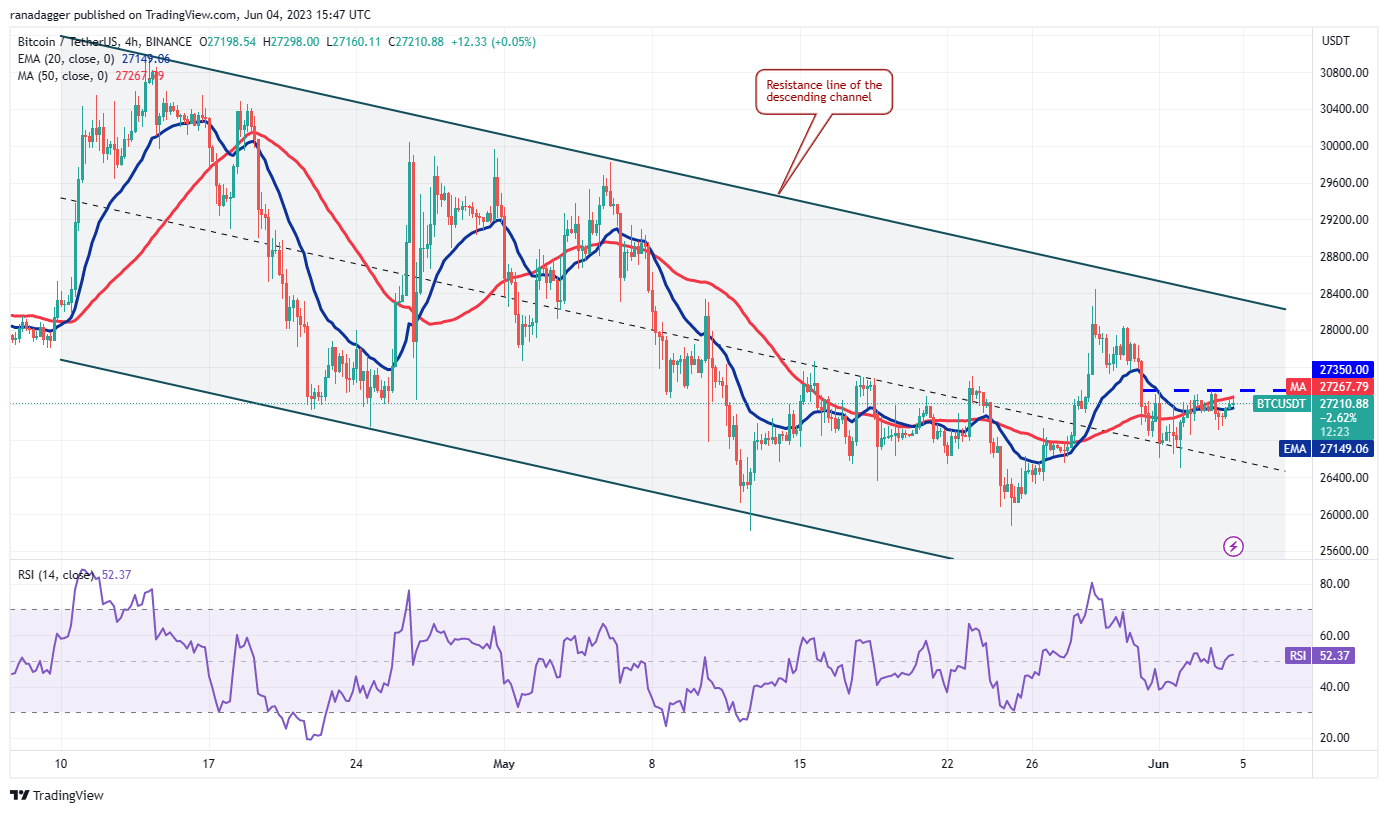
The 4-hour chart shows that the bears are guarding the immediate resistance of $27,350. On the downside, the pair has been forming higher lows in the near term, indicating demand at lower levels. This enhances the prospects of a rally above the overhead resistance. If that happens, the pair may soar to the resistance line of the descending channel.
If bears want to gain the upper hand, they will have to quickly sink the price below the nearest support at $26,505. The next stop on the downside could be $26,360 and then $25,800.
Cardano price analysis
Cardano…
Click Here to Read the Full Original Article at Cointelegraph.com News…
