Key points:
-
Bitcoin selling is mainly attributed to large sales by whales, not a chance in BTC’s market structure.
-
Despite the sharp market correction, Ether and BNB remain strong on the charts.
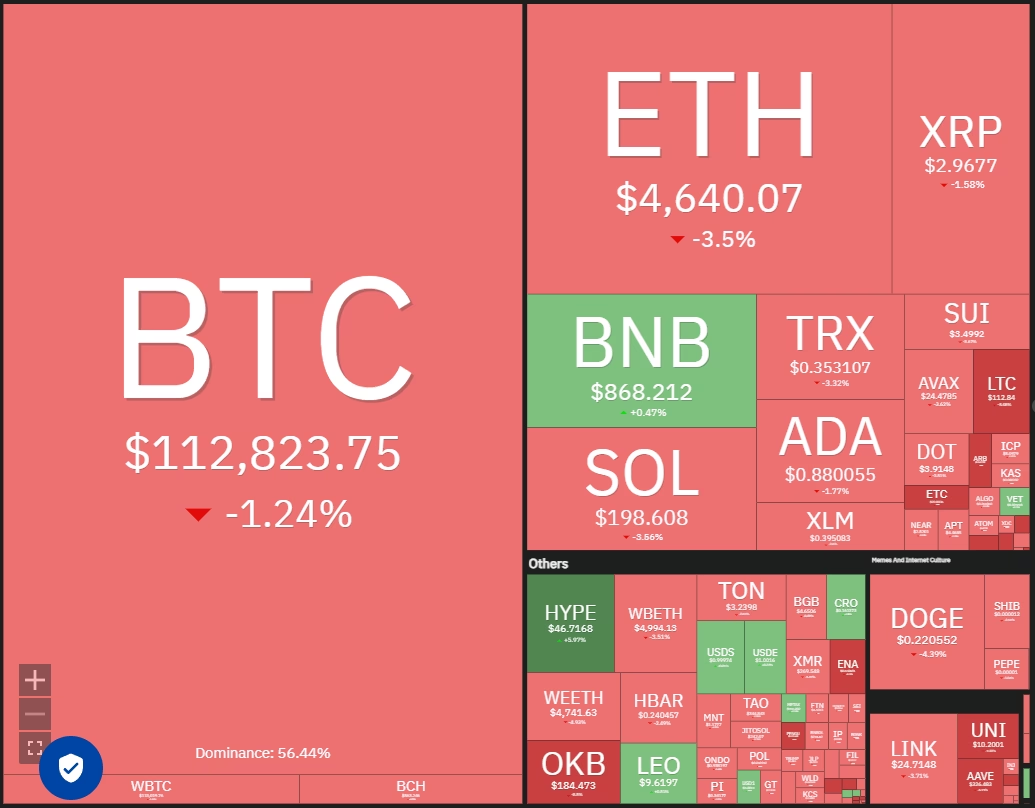
Bitcoin (BTC) bulls are defending the $110,530 support, but the bears have kept up the pressure. CoinShares reported $1 billion in net outflows from BTC exchange-traded products last week.
Investor interest seems to be shifting from BTC to Ether (ETH). Month-to-date ETH ETPs witnessed $2.5 billion in inflows, while BTC has seen $1 billion in outflows.
Data from crypto intelligence firm Arkham uploaded to X by analytics account Lookonchain showed that a whale entity deposited about 22,769 BTC ($2.59 billion) to Hyperliquid (HYPE) for sale and then purchased 472,920 $ETH ($2.22 billion) in spot and opened 135,265 $ETH ($577M) long position.
In contrast, Michael Saylor’s Strategy, the world’s largest public BTC holder, bought 3,081 BTC for $356.9 million, boosting the firm’s BTC holdings to 632,457 BTC, according to a US Securities and Exchange Commission filing on Monday.
Could buyers maintain BTC above its crucial support? Could ETH’s strength trigger an altcoin rally? Let’s analyze the charts of the top 10 cryptocurrencies to find out.
S&P 500 Index price prediction
The S&P 500 Index (SPX) turned up sharply from the 20-day exponential moving average (6,392) on Friday, signaling solid buying on dips.
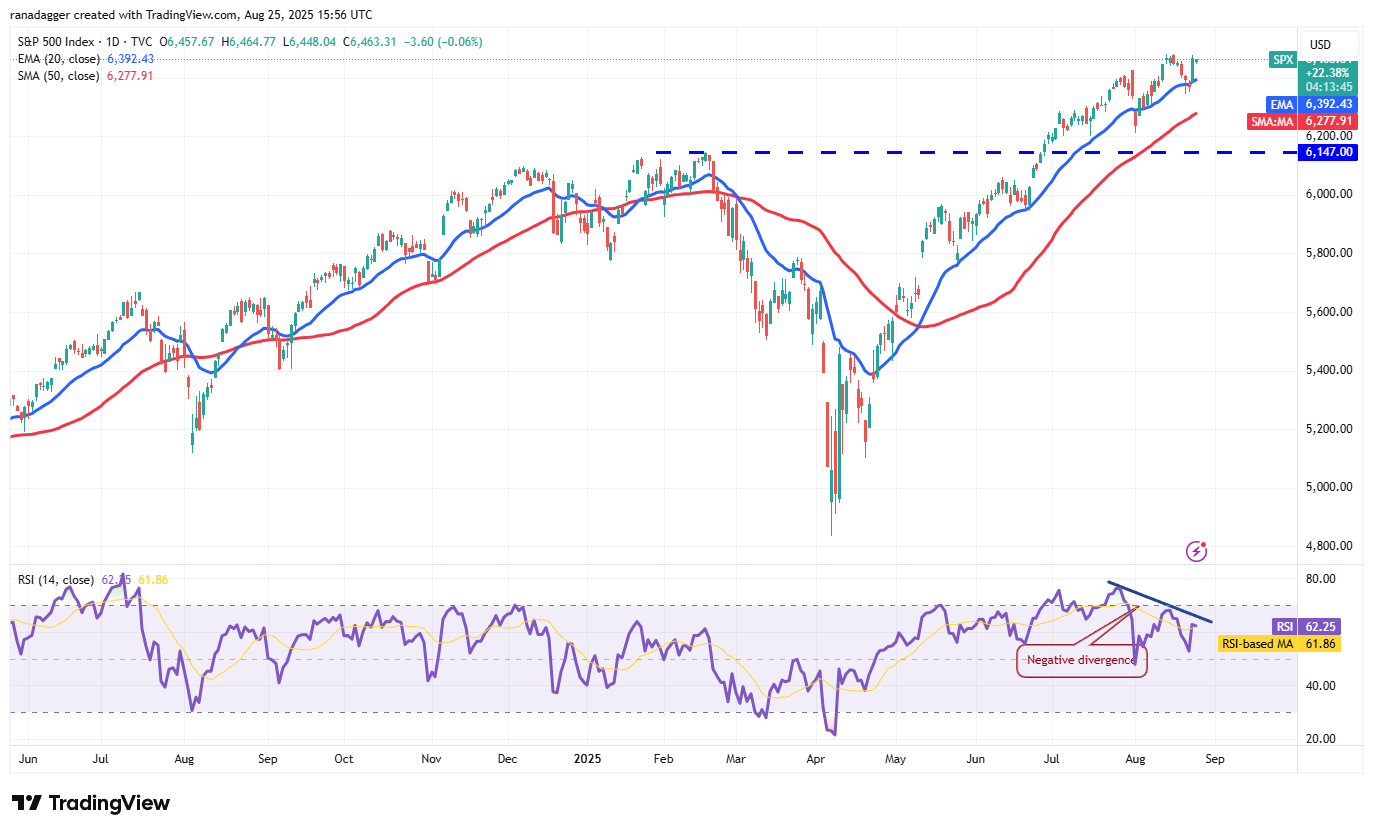
Buyers will try to strengthen their position further by pushing the price above 6,581. If they can pull it off, the index could rally to 6,696.
Although the trend remains up, the relative strength index (RSI) is flashing signs of a negative divergence. That suggests the bullish momentum is weakening. The bears will have to pull and retain the price below the 20-day EMA to accelerate selling. The index could then plunge to the breakout level of 6,147.
US Dollar Index price prediction
The US Dollar Index (DXY) rose above the moving averages on Thursday, but the higher levels attracted solid selling by the bears.
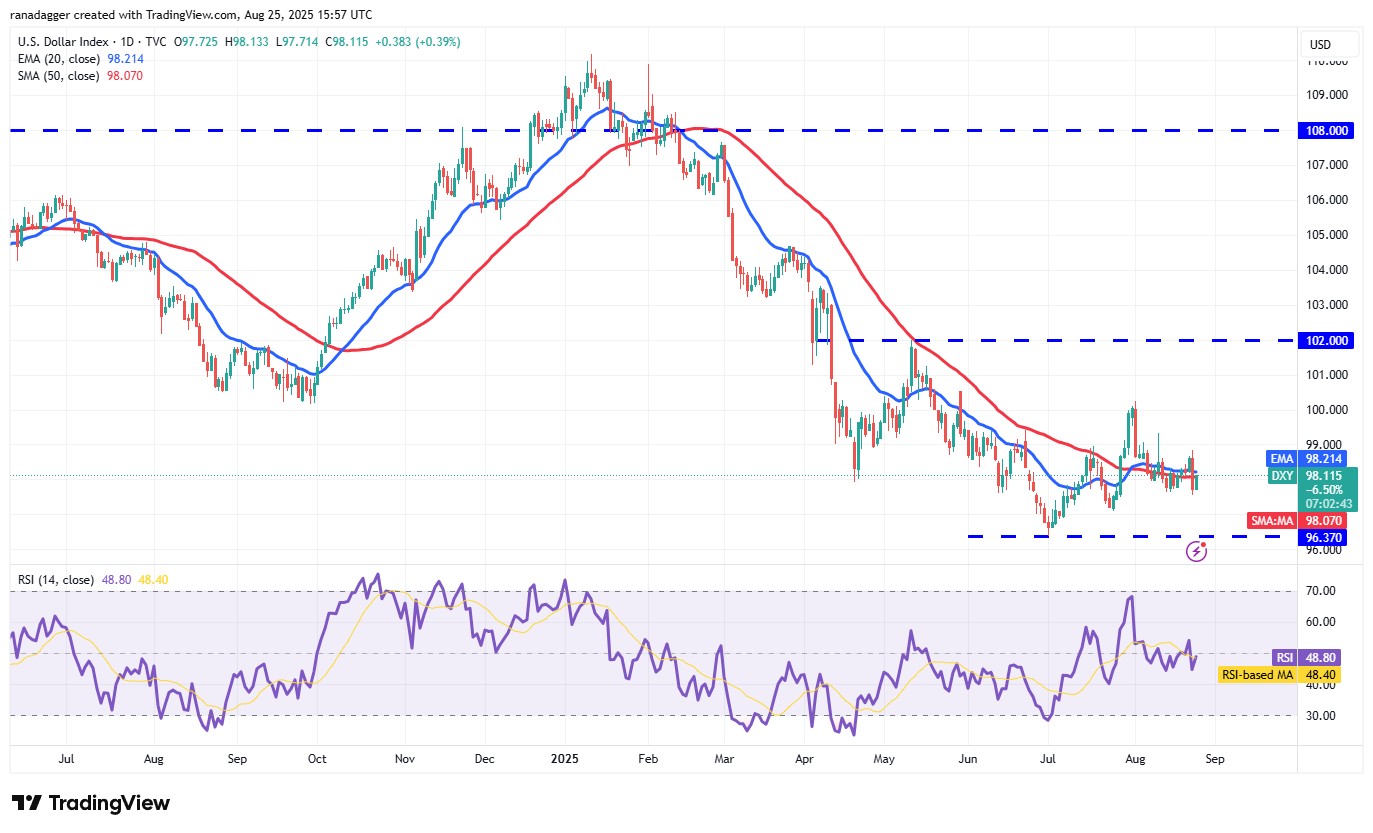
The moving averages are sloping down gradually, and the RSI is just below the midpoint, suggesting a minor advantage to the bears. If the price dips below 97.50, the next stop could be 97 and then 96.37.
Buyers will have to swiftly push the price back above the 99 level to signal strength. The index may then…
Click Here to Read the Full Original Article at Cointelegraph.com News…