Key takeaways:
-
XRP confirms a bearish descending triangle on the daily chart, risking an 18% drop to $2.40.
-
Declining daily active addresses signal reduced transaction activity and cooling demand for XRP.
-
Spot taker CVD remains negative, suggesting waning investor demand.
XRP (XRP) traded 23% below its multi-year peak of $3.66, and a convergence of several data points signals a possible drop toward $2.40.
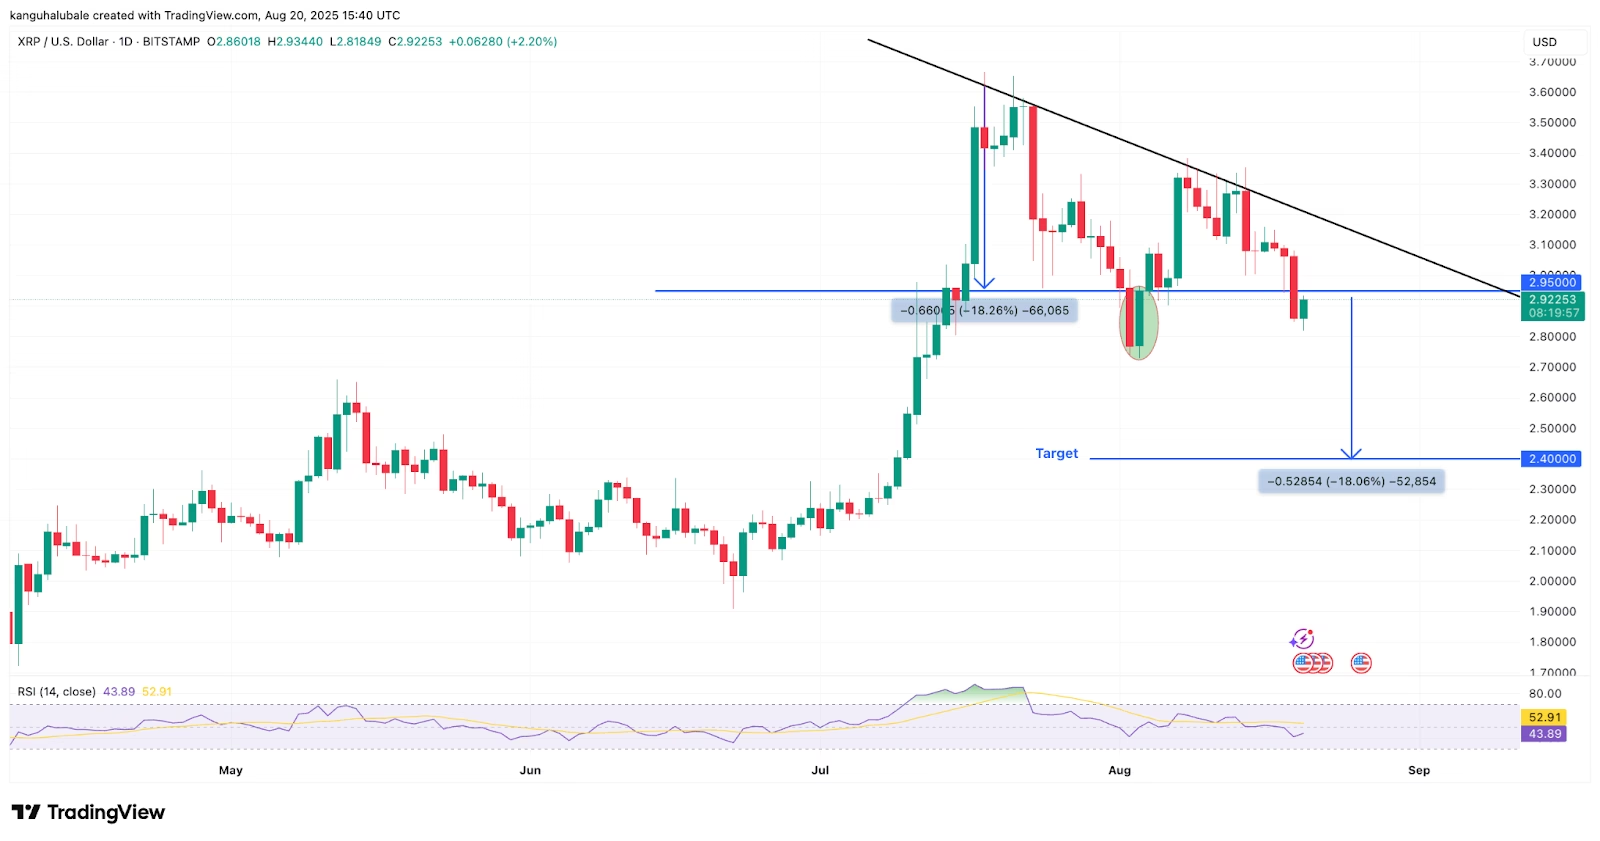
Data from Cointelegraph Markets Pro and TradingView shows XRP trading below a descending triangle in the daily time frame, as shown in the chart below.
A descending triangle is a bearish chart pattern, characterized by a flat, horizontal support line and a descending upper trendline that slopes downward.
The price broke below the support line of the prevailing chart pattern at $2.95 on Tuesday to continue the downward trend, with a measured target of $2.40.
Such a move would bring the total gains to 18% from the current level.
As Cointelegraph reported, the altcoin needs to reclaim the $3 support level to avoid a deeper correction to $2.24. The last two times the price reclaimed this level in the recent past were in mid-July and early August, preceding 25% and 15% rallies, respectively.
XRP/BTC bearish divergence
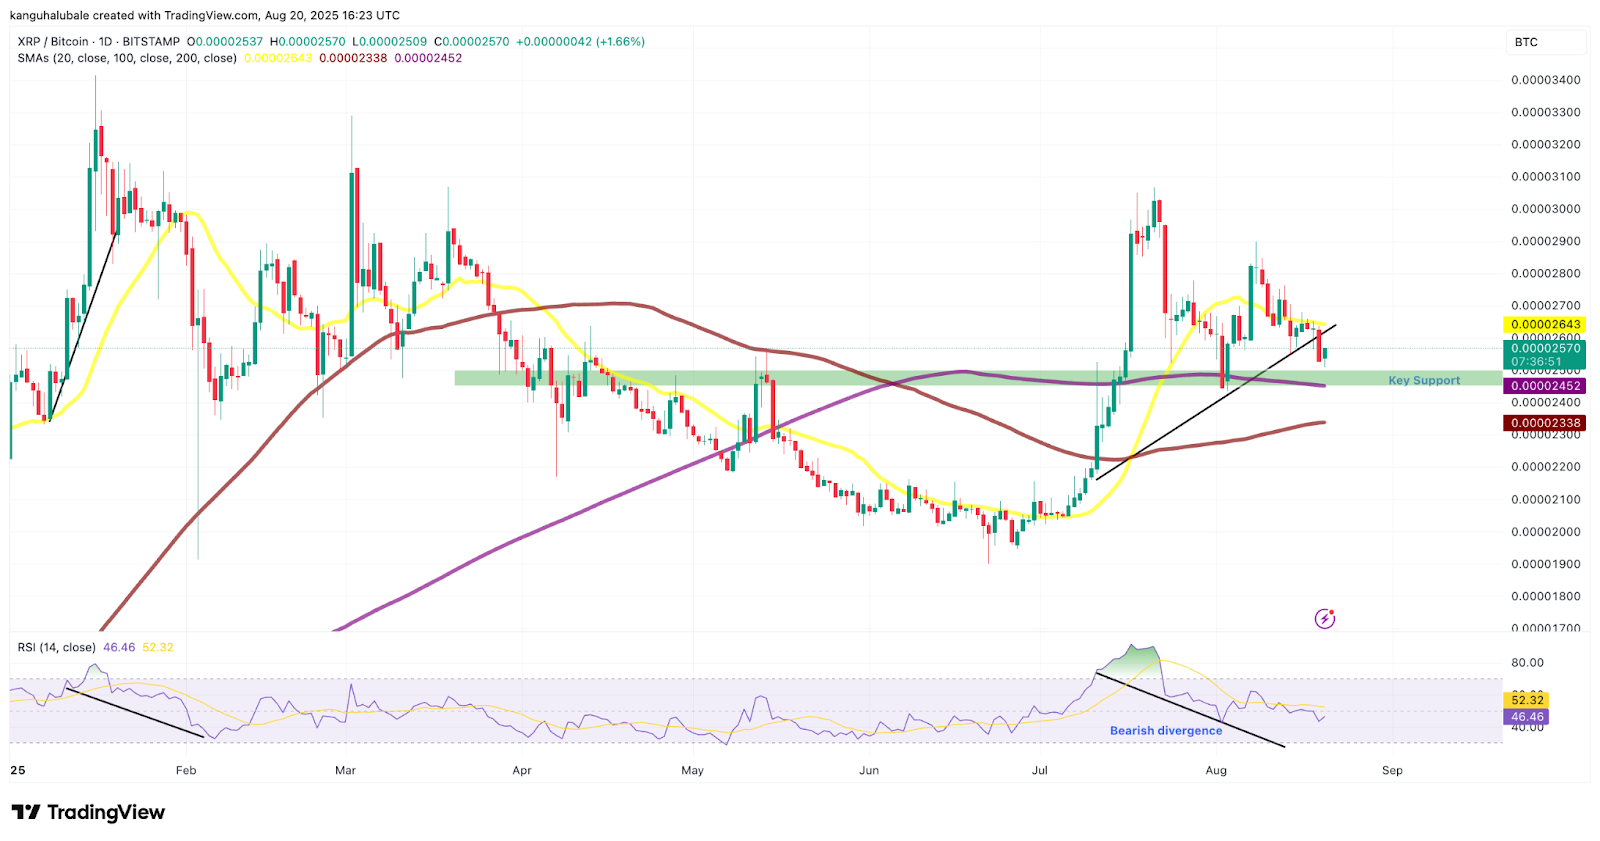
XRP’s bearishness is supported by a growing bearish divergence between its XRP/BTC pair and the relative strength index (RSI).
The daily chart below shows that the XRP/BTC pair rose between July 10 and Aug. 18, forming higher lows.
But, in the same period, its daily RSI descended to 43 from overbought conditions at 75 over the same time frame, forming lower lows, as shown in the chart below.
Related: Price predictions 8/18: SPX, DXY, BTC, ETH, XRP, BNB, SOL, DOGE, ADA, LINK
A negative divergence between falling prices and a rising RSI usually indicates weakness in the prevailing uptrend, prompting traders to book profits at higher levels as investor interest decreases and buyer exhaustion sets in.
The chart above also reveals that XRP/BTC sits above a key support zone between 0.0000245 BTC and 0.0000250 BTC, embraced by the 200-day simple moving average.
A drop below this area could see the XRP/BTC pair continue its downtrend, fueled by a further drop in XRP price.
Declining network activity could amplify XRP sell-off
The XRP Ledger has experienced a significant drop in network activity compared to Q1/2025 and the period between June and July….
Click Here to Read the Full Original Article at Cointelegraph.com News…