
Key takeaways:
-
Bitcoin shows bearish divergences on multiple time frames, signaling weak bullish momentum and a potential pullback.
-
Some traders anticipate a rally above $112,000, but increasing sell pressure and liquidity sweeps suggest the breakouts are traps.
Bitcoin (BTC) price rallied to $110,500 on Thursday, but the cryptocurrency is encountering a ceiling as multiple bearish divergences flash across different timeframes.
On the 15-minute, one-hour, and four-hour charts, technical analysts have flagged divergence signals, where the price continues to rise while momentum indicators, such as the relative strength index trend lower. This suggests a weakening bullish drive, raising the risk of a near-term pullback.
Zooming out to the one-day chart reinforces the cautious outlook. In May, a clear bearish divergence emerged between price and momentum indicators, aligning with Bitcoin’s all-time high of $111,800. Although BTC briefly dipped below $100,000 since then, the divergence remains intact, suggesting that underlying bearish pressure could still exert influence. The immediate target below remains between $107,500 and $106,000.
This bearish bias was reinforced after Friday’s US Non-Farm Payroll (NFP) data, which came in hotter than expected. While the labor report initially helped push BTC toward $110,000, bulls failed to maintain that breakout. The rejection at this key psychological level may signal exhaustion at the current range highs.
Interestingly, funding rates remain neutral. In an X post, Vetle Lunde of K33 Research pointed out that the perpetual futures funding rate remains flat even with BTC brushing against its all-time high range. This lack of aggressive long positioning shows traders may not be fully convinced of a sustained breakout, which aligns with the current technical divergences.
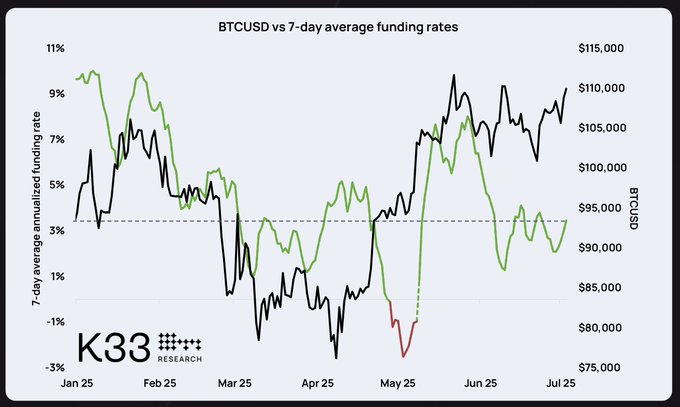
Related: Bitcoin price rallied 80% the last time BTC funding rates flipped red
Was Bitcoin’s rally to $110,000 a bull or bear trap?
As Bitcoin consolidates just below the $110,000 level, traders remain split on the next big move.
Pseudonymous trader Byzantine General shared a chart noting that Bitcoin may be coiling for a $112,000 break based on futures data. The setup suggests open interest breaking out with the price, which historically has led to a higher target.
While market order books are…
Click Here to Read the Full Original Article at Cointelegraph.com News…