Key points:
-
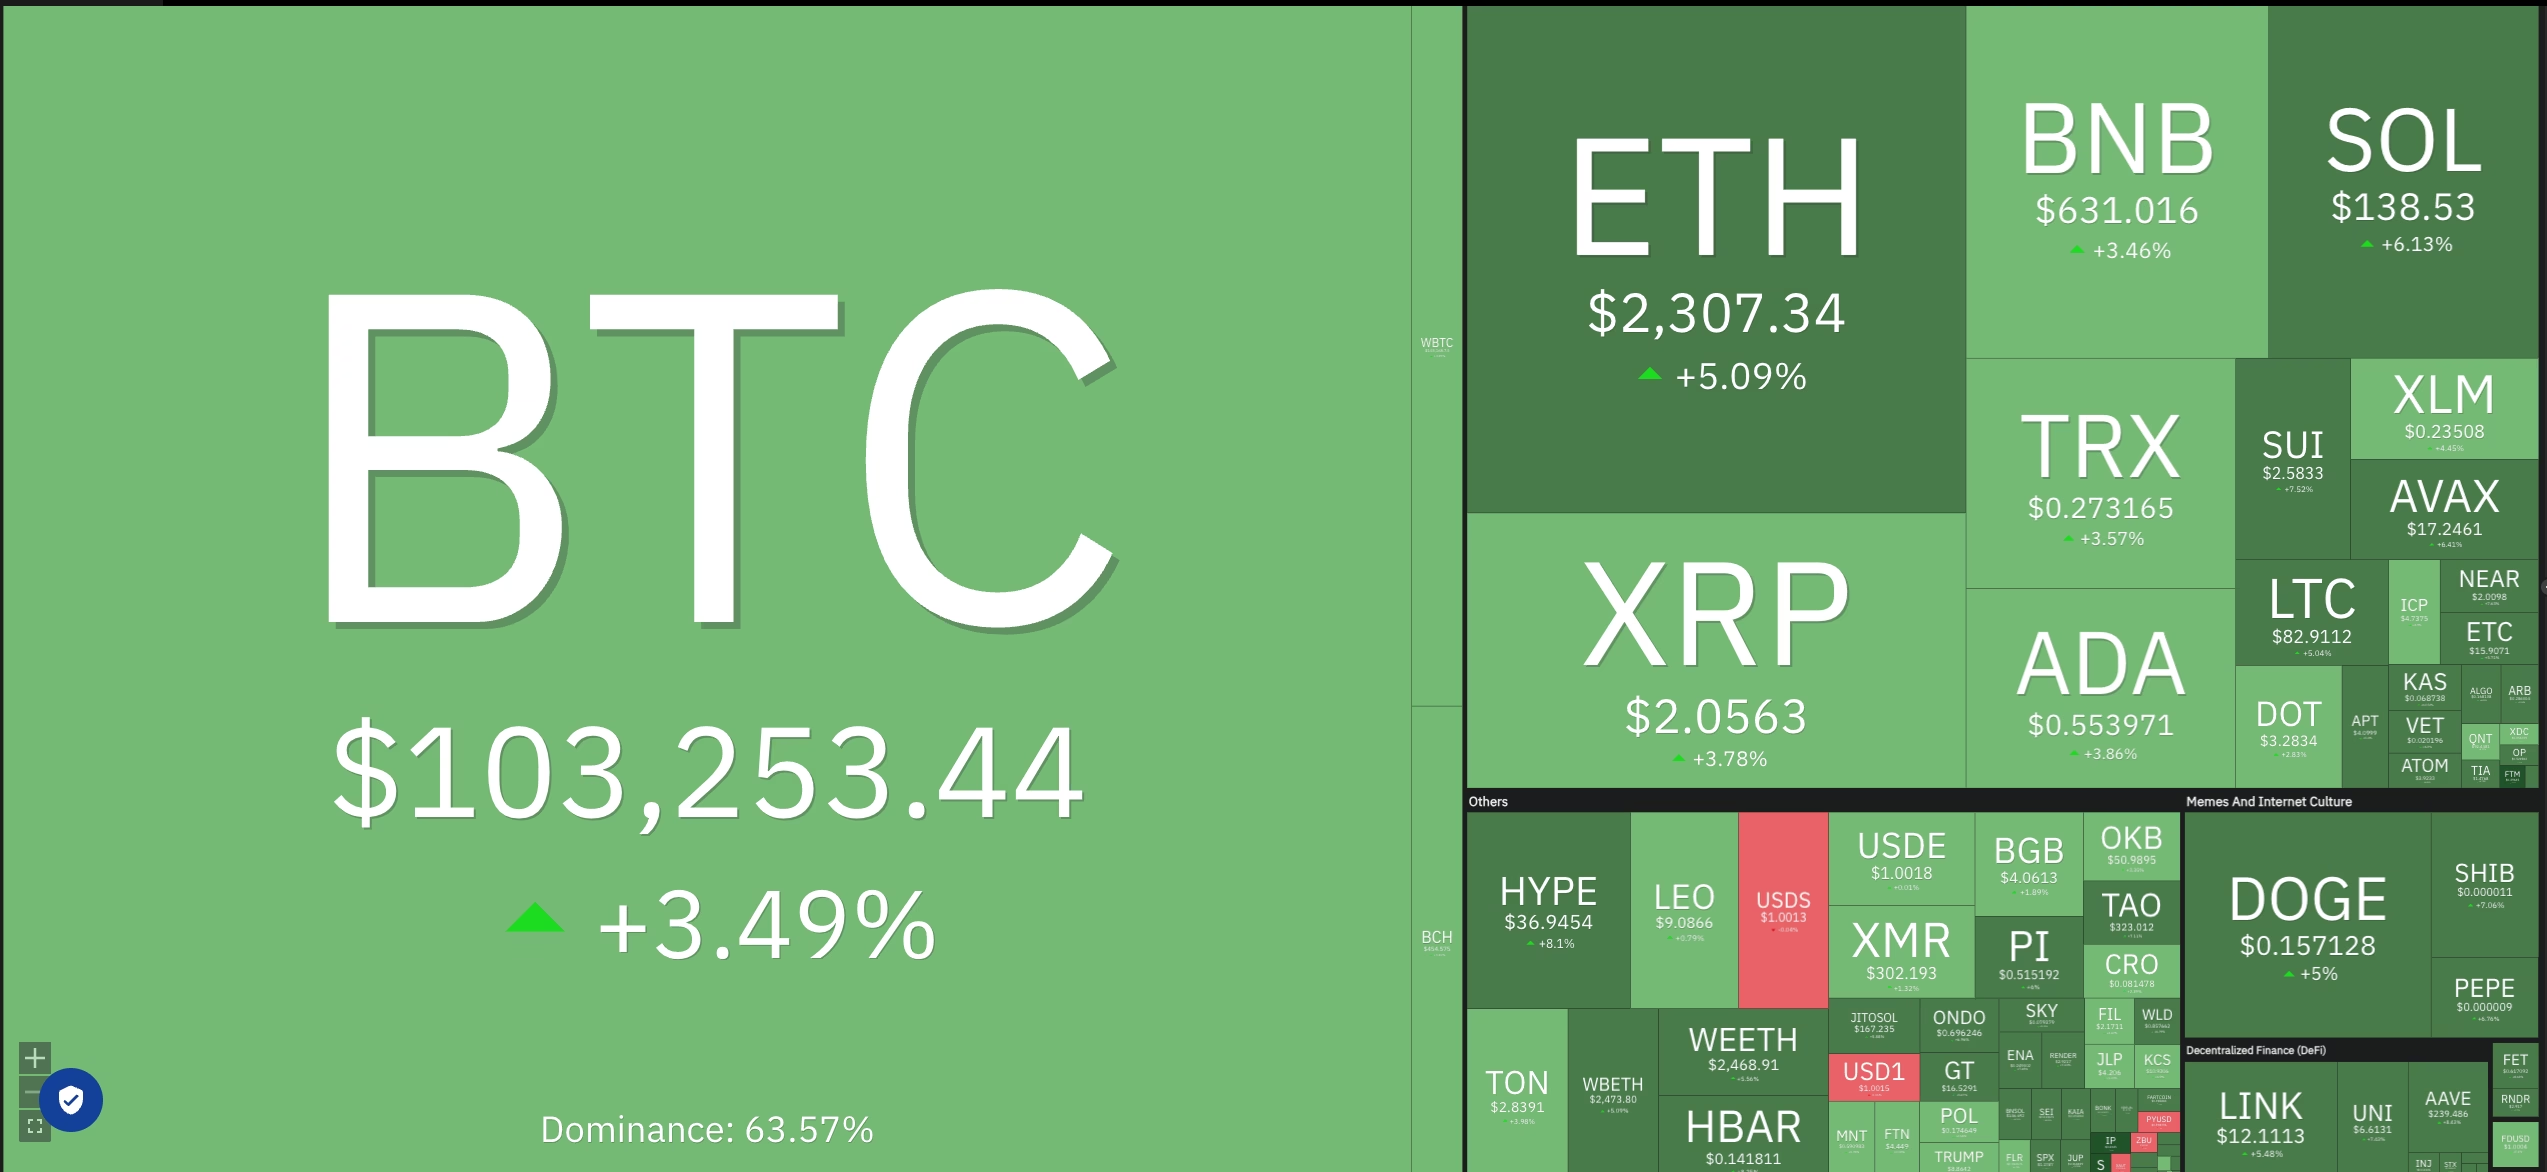
Bitcoin’s bounce from $100,000 shows buyers are committed to the overarching bull trend.
-
Select altcoins have broken below respective support levels, suggesting further weakness for mid-caps in the near term.
Bitcoin (BTC) has held above the psychological support of $100,000, but the strength of each will determine whether the bullish trend remains intact. BitMEX founder Arthur Hayes sounded positive in a post on X, saying that Bitcoin’s weakness shall pass, leaving no doubt about its safe haven status.
Bitcoin’s relative stability compared to the top US stocks during the current geopolitical crisis shows it is maturing as an asset class. Bitwise Europe Head of Research André Dragosch shared a chart on X, showing Bitcoin’s 60-day realized volatility at 27-28%, lower than the S&P 500 Index (SPX) at roughly 30%, the Nasdaq 100 at about 35% and the “Magnificent 7” technology stocks close to 40%.
The failure to break out to a new high has not created panic among institutional investors, who continue to buy Bitcoin. CoinShares reported on Monday that Bitcoin exchange-traded products (ETPs) witnessed inflows of $1.1 billion for the trading week ending Friday. Inflows, despite a fall in the spot price, show that investors were buying on weakness, the report added.
Could sellers pull Bitcoin back below $100,000, or will buyers succeed in pushing the price higher? How are altcoins likely to behave? Let’s analyze the charts of the top 10 cryptocurrencies to find out.
S&P 500 Index price prediction
The S&P 500 Index has pulled back to the 20-day exponential moving average (EMA) (5,950), indicating selling by the bears in the 6,000 to 6,147 zone.
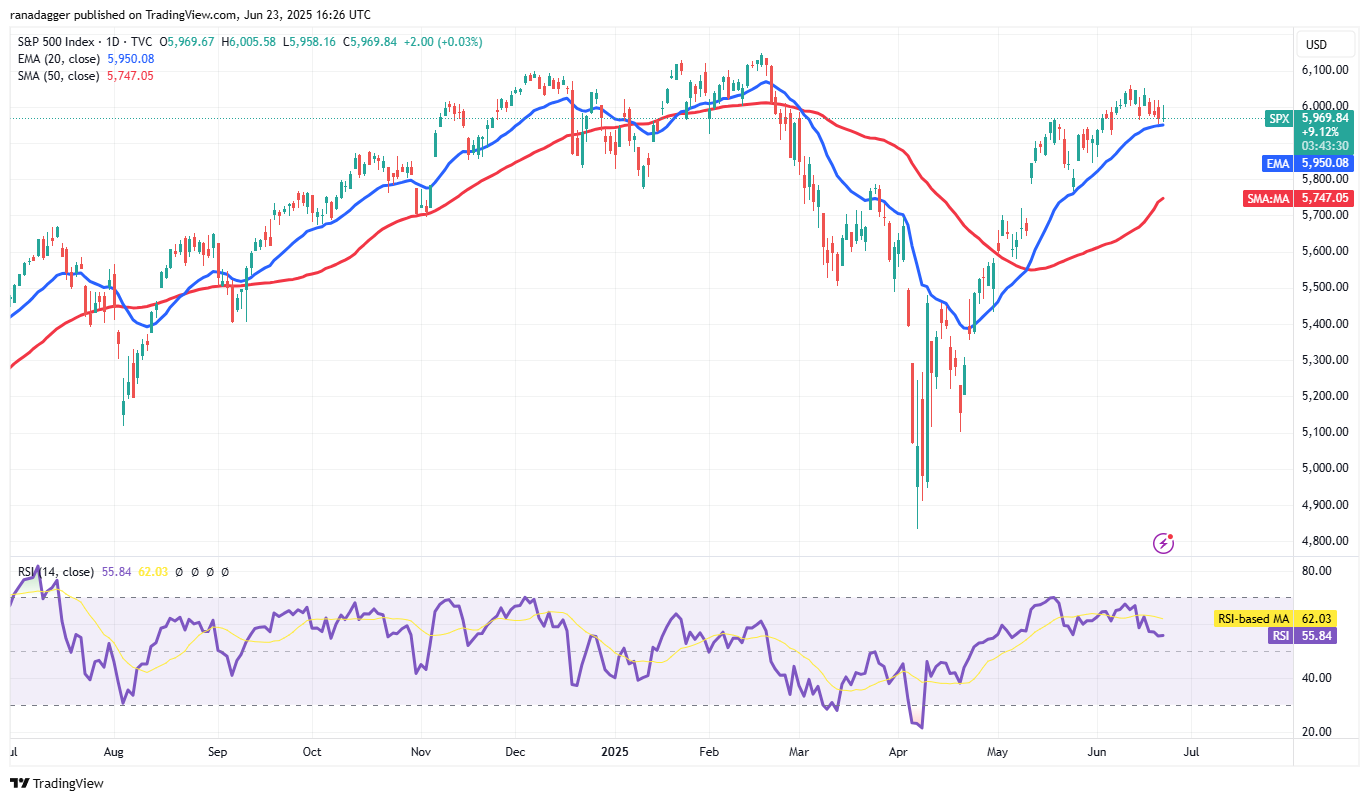
If the price dips and maintains below the 20-day EMA, the index could plunge to the 50-day simple moving average (SMA) (5,747). Buyers are expected to defend the 50-day SMA with all their might because a break below it may sink the index to 5,580. The deeper the pullback, the greater the time needed for the uptrend to resume.
This negative view will be invalidated if the price bounces off the 20-day EMA and rises above 6,060. That sets the stage for a retest of the all-time high at 6,147. A break above the 6,147 level signals the start of the next leg of the uptrend toward 6,500.
US Dollar Index price prediction
The failure of the bears to sustain the price below the 97.92 support started a bounce, which has…
Click Here to Read the Full Original Article at Cointelegraph.com News…