Bitcoin (BTC) has been trading in a tight range for a few days, but a minor positive is that the bulls have kept the price above $83,000. Usually, a low volatility period is followed by a range expansion, but it is difficult to predict the direction of the breakout with certainty.
Cryptocurrency analysts remain bullish on Bitcoin’s prospects because gold’s rally in 2017 and 2020 was followed by a sharp rise in Bitcoin’s price. Theya head of growth Joe Consorti said in a post on X that Bitcoin follows gold with a lag of roughly 100 to 150 days.
If Bitcoin moves as per Consorti’s expectations, a new all-time high could be hit between Q3 and Q4 of 2025. On similar lines, trading and analytics account Cryptollica projected a medium-term target of $155,000 for Bitcoin.
Along with Bitcoin, analysts are also bullish on altcoins. Swiss bank Sygnum said in its Q2 2025 investment outlook that improved regulations for crypto use cases have prepared the ground for a strong altcoins rally in the second quarter, as “none of the positive developments have been priced in.”
Could Bitcoin and the altcoins break above their respective overhead resistance levels and start a recovery? Let’s analyze the charts of the top 10 cryptocurrencies to find out.
Bitcoin price analysis
Bitcoin has been trading between the 20-day exponential moving average ($83,463) and the 200-day simple moving average ($87,857), indicating a tough battle between the bulls and the bears.
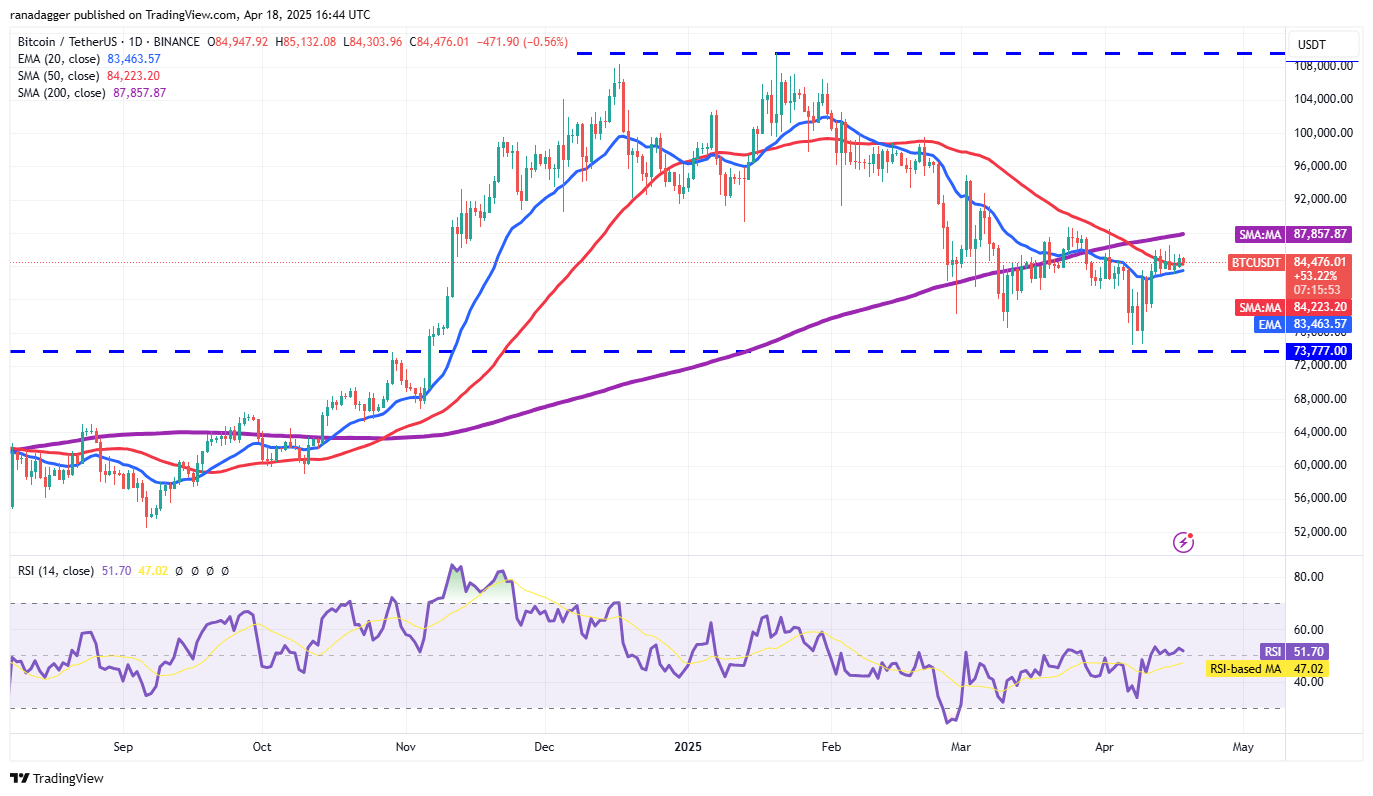
If the 20-day EMA cracks, the selling could pick up, and the BTC/USDT pair may slide to $78,500 and then to $73,777. Buyers are expected to defend the $73,777 level with all their might because a break below it may signal the start of a downtrend.
On the contrary, a break and close above the 200-day SMA indicates that the corrective phase may be over. The pair could climb to $95,000 and eventually to the psychologically critical level of $100,000.
Ether price analysis
Ether (ETH) has been trading between the $1,368 support and the $1,754 resistance, indicating indecision between the bulls and the bears.
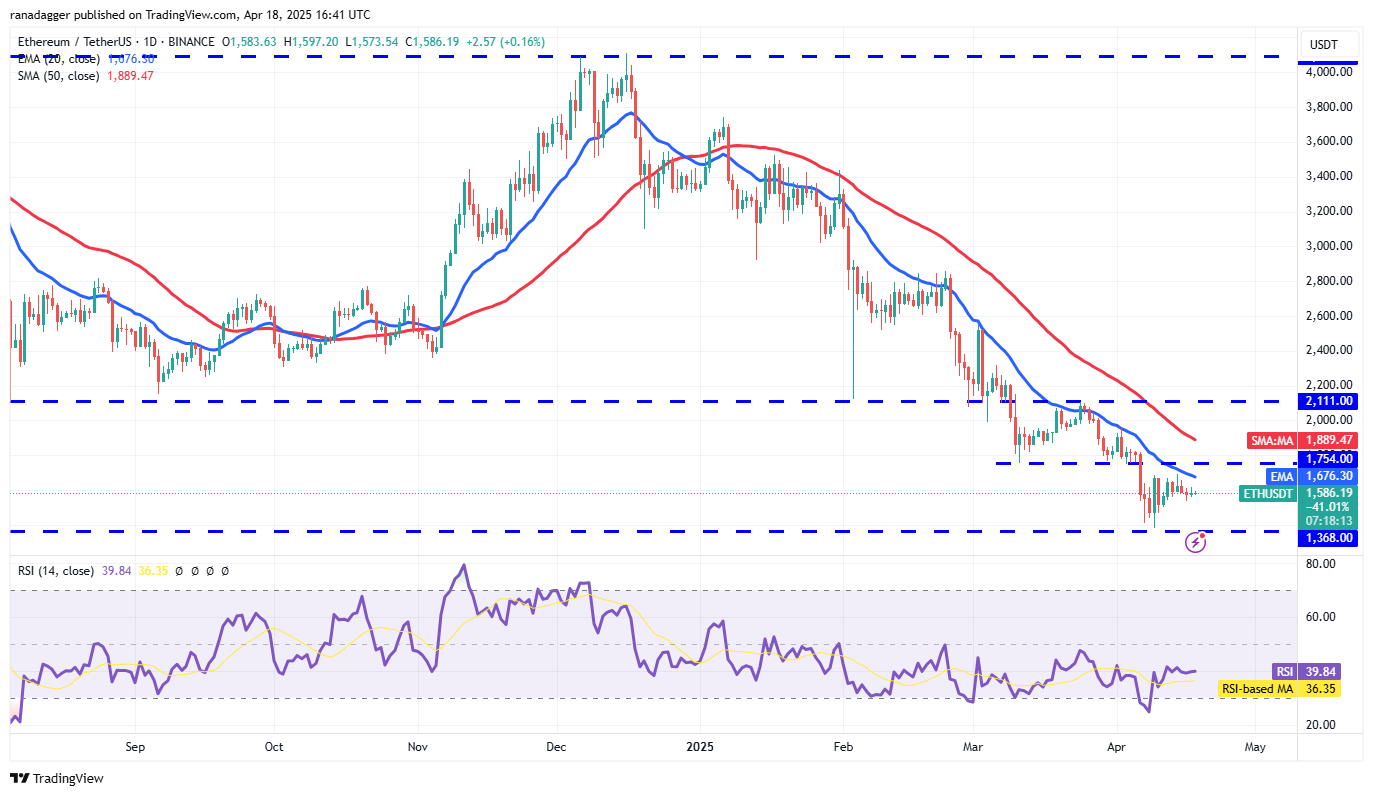
The downsloping moving averages and the RSI in the negative territory suggest a slight edge to the sellers. If the price slips below $1,471, the ETH/USDT pair could descend to $1,368. Buyers are expected to vigorously defend the $1,368 support because a break…
Click Here to Read the Full Original Article at Cointelegraph.com News…