

Bitcoin (BTC) bulls have pushed the price above the $87,000 level even as US trade tariffs are slated to kick in on April 2. Bitcoin may remain volatile in the near term, but analysts remain bullish for the long term.
According to Fidelity analyst Zack Wainwright, Bitcoin is currently in an acceleration phase, which “can conclude with a sharp, dramatic rally” if history repeats itself. If that happens, Wainwright expects $110,000 to be the starting base of the next leg of the upmove.

Crypto market data daily view. Source: Coin360
BitMEX co-founder and Maelstrom chief investment officer Arthur Hayes said in a post that if the Federal Reserve pivots to quantitative easing, then Bitcoin could rally to $250,000 by year-end.
Could Bitcoin break above the $89,000 overhead resistance, starting a rally in select altcoins? Let’s analyze the charts of the top 10 cryptocurrencies to find out.
Bitcoin price analysis
Bitcoin has risen close to the resistance line, where the sellers are expected to pose a solid challenge.
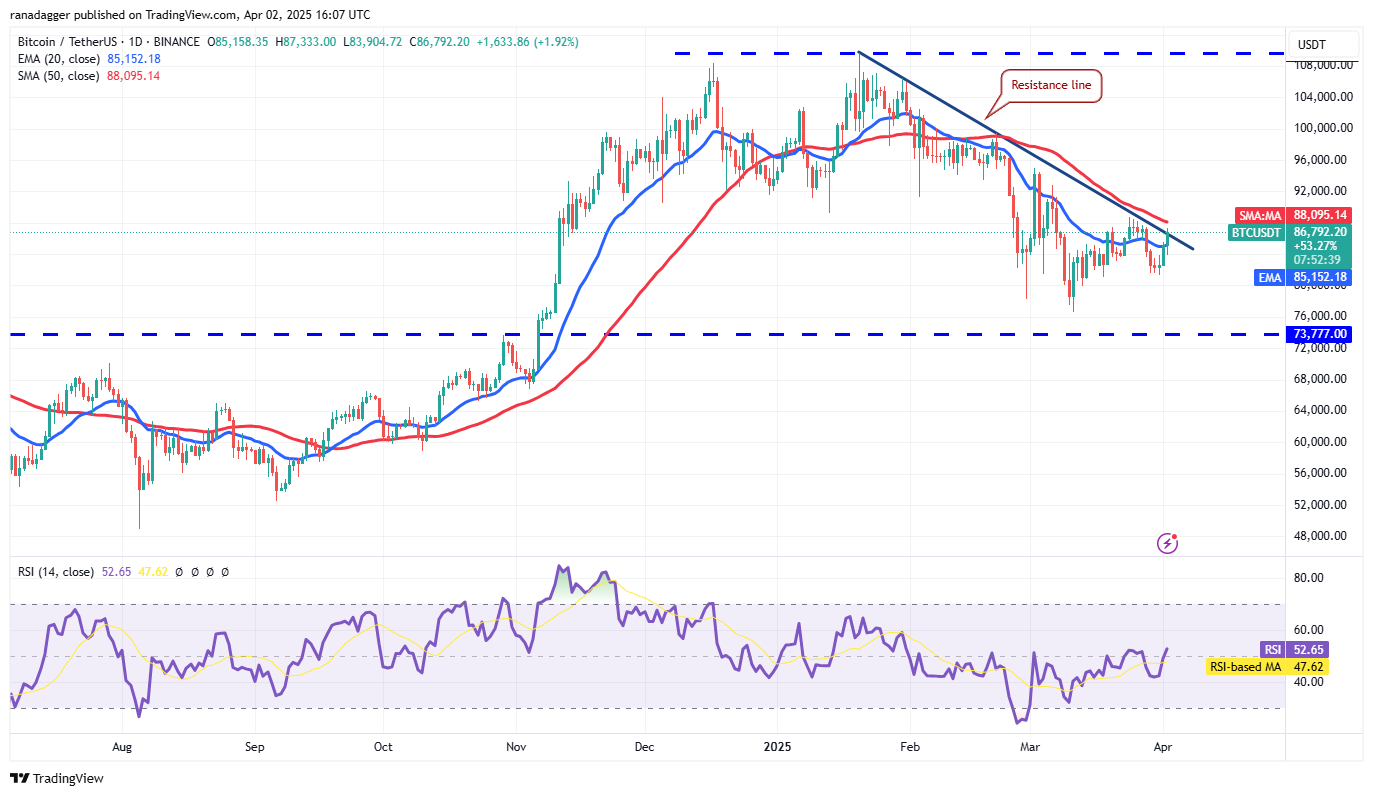
BTC/USDT daily chart. Source: Cointelegraph/TradingView
The flattening 20-day exponential moving average ($85,152) and the relative strength index (RSI) just above the midpoint signal the bears are losing their grip. That improves the prospects of a rally above the resistance line. If that happens, the BTC/USDT pair could climb to $95,000 and eventually to $100,000.
Alternatively, if the price turns down sharply from the resistance line and breaks below $81,000, it will suggest that the bears are back in the driver’s seat. The pair may then tumble to $76,606.
Ether price analysis
Ether (ETH) rebounded off the $1,754 support on March 31, signaling that the bulls are attempting to form a double-bottom pattern.
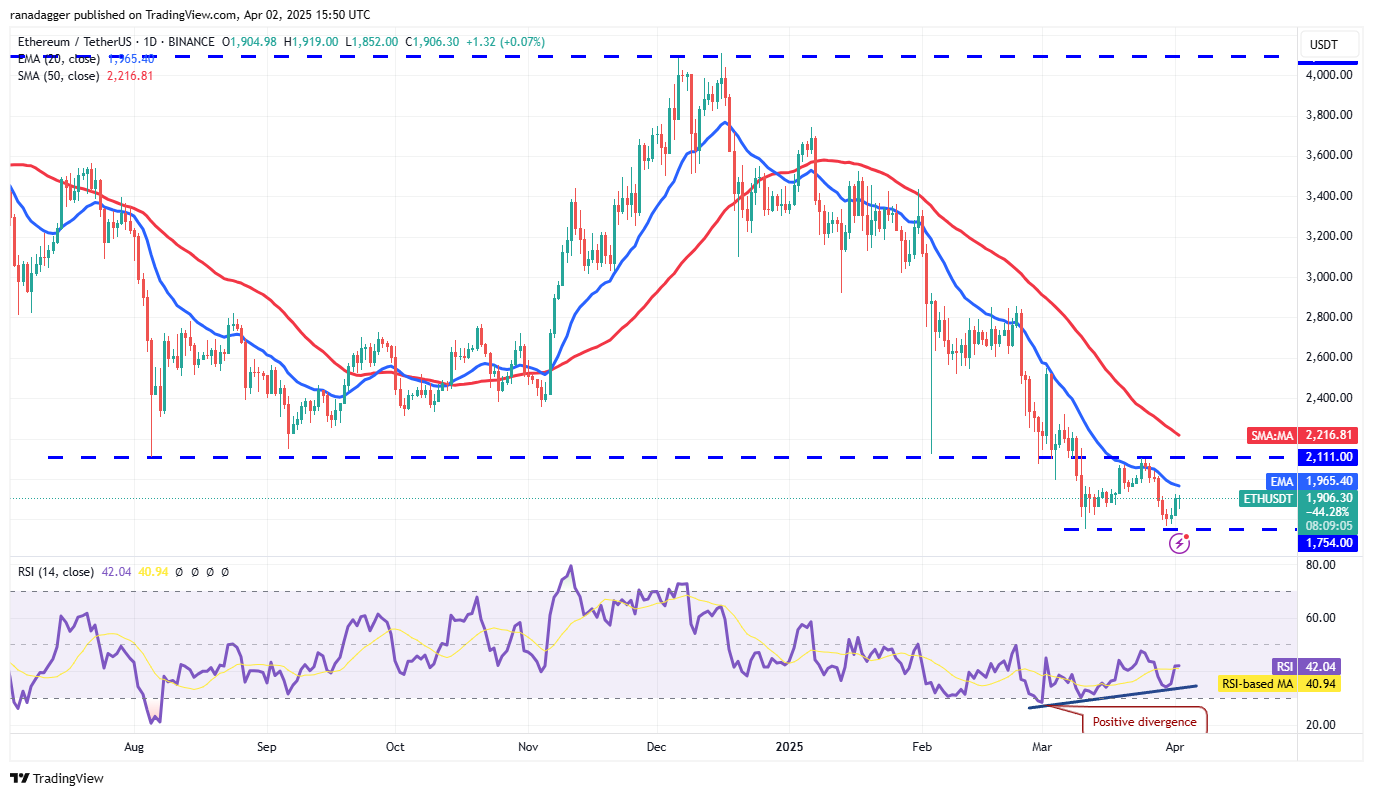
ETH/USDT daily chart. Source: Cointelegraph/TradingView
The bears will try to stall the relief rally at the 20-day EMA ($1,965). If the price turns down from the 20-day EMA, the possibility of a break below $1,574 increases. The ETH/USDT pair may then collapse to $1,550.
Contrarily, a break and close above the 20-day EMA opens the doors for a rise to the breakdown level of $2,111. If buyers pierce this resistance, the pair will complete a double-bottom pattern, starting a rally to the target objective of $2,468.
XRP price analysis
XRP’s (XRP) weak bounce off the crucial $2 support suggests a lack of aggressive buying by the bulls at the current levels.

XRP/USDT daily chart. Source: Cointelegraph/TradingView
That heightens the risk of a break below $2. If that…
Click Here to Read the Full Original Article at Cointelegraph.com News…