

Bitcoin (BTC) has largely stayed above $80,000 since March 11, indicating that the bulls are not waiting for a deeper correction to buy. However, the failure to propel the price above $86,000 shows that the bears have not given up and continue to sell on rallies.
CoinShares’ weekly report shows that cryptocurrency exchange-traded products (ETPs) witnessed $1.7 billion in outflows last week. That takes the total five-week outflows to $6.4 billion. Additionally, the streak of outflows has reached 17 days, marking the longest negative streak since CoinShares records began in 2015.
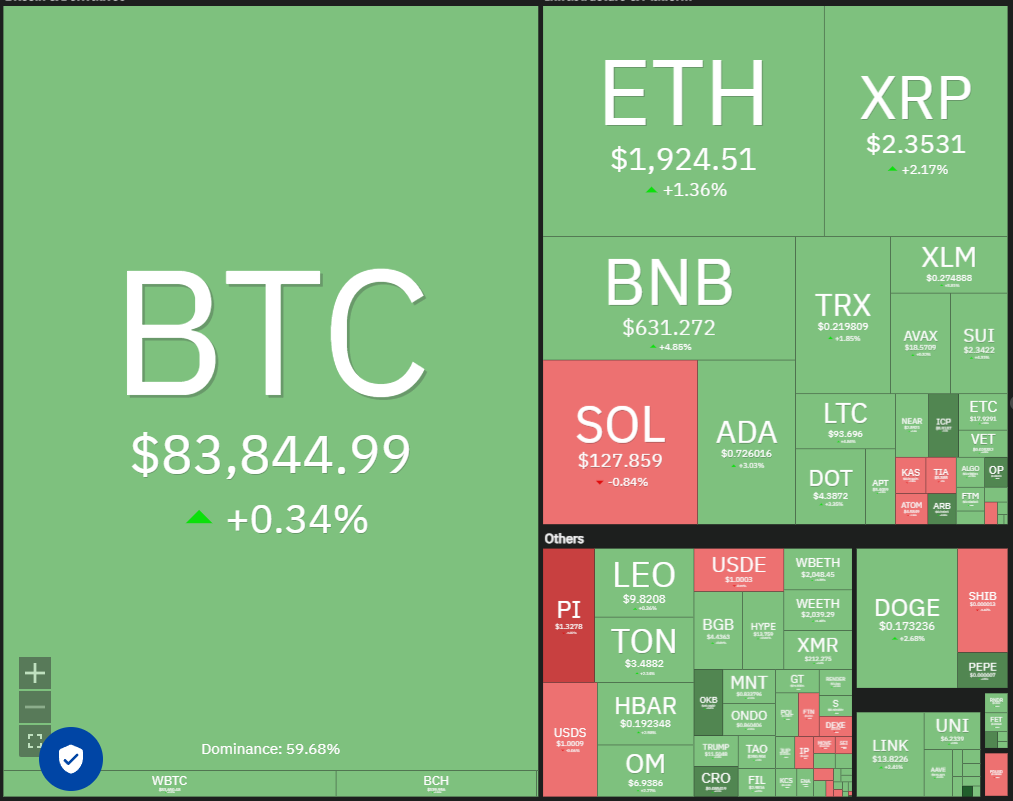
Daily cryptocurrency market performance. Source: Coin360
It’s not all gloom and doom for the long-term investors. CryptoQuant contributor ShayanBTC said that investors who purchased Bitcoin between three and six months ago are showing an accumulation pattern. Historically, similar behavior has “played a crucial role in forming market bottoms and igniting new uptrends.”
Will buyers succeed in catapulting Bitcoin above the overhead resistance levels? How are the altcoins placed? Let’s analyze the charts to find out.
S&P 500 Index price analysis
The S&P 500 Index (SPX) is in a strong corrective phase. The fall to 5,504 on March 13 sent the relative strength index (RSI) into the oversold territory, signaling a possible relief rally in the near term.
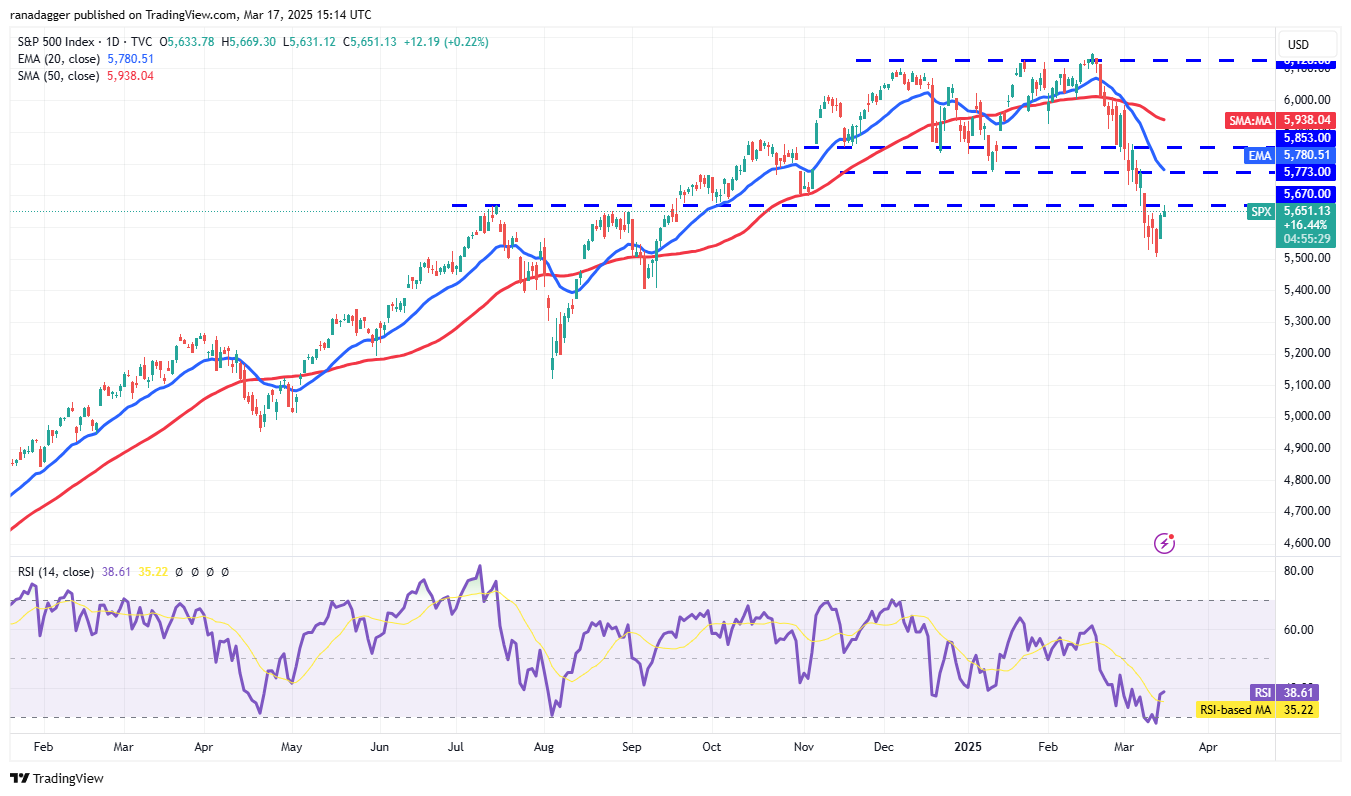
SPX daily chart. Source: Cointelegraph/TradingView
The bears will try to halt the recovery in the 5,670 to 5,773 resistance zone. If they succeed, it will signal that the sentiment remains negative and traders are selling on rallies. That heightens the risk of a fall to 5,400. The bulls are expected to defend the 5,400 level with all their might because a drop below it may sink the index to 5,100.
On the upside, a break and close above the 20-day exponential moving average (5,780) will signal strength. The index may then climb to the 50-day simple moving average (5,938).
US Dollar Index price analysis
The weak rebound off the 103.37 support in the US Dollar Index (DXY) suggests that the bears have kept up the pressure.
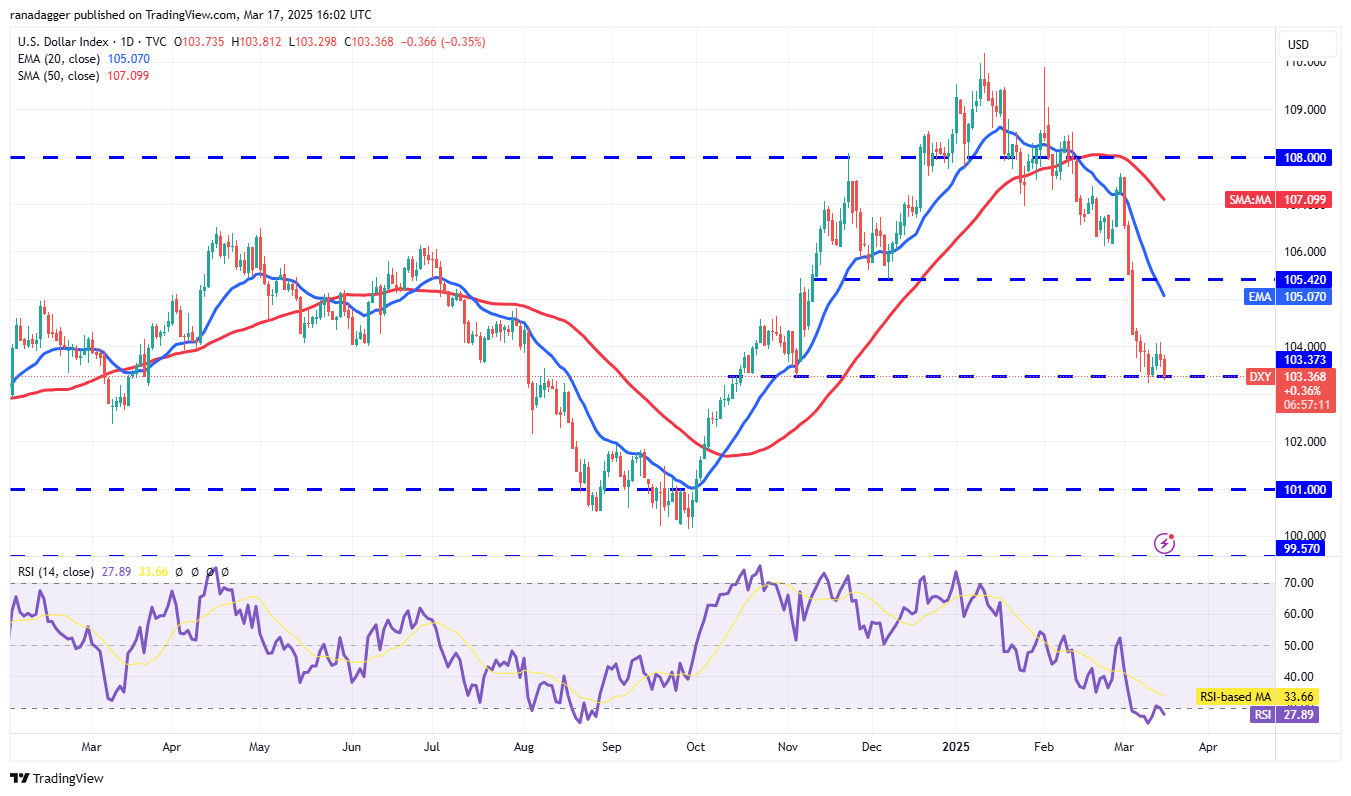
DXY daily chart. Source: Cointelegraph/TradingView
Sellers are trying to sink the index below 103.37. If they can pull it off, the decline could extend to 102 and thereafter to 101.
Conversely, if the price turns up from the current level and breaks above 104, it will signal that buyers are trying to make a comeback. The index could rise to the 20-day EMA (105), which is likely to attract sellers. If buyers do not cede much ground to…
Click Here to Read the Full Original Article at Cointelegraph.com News…