

Bitcoin (BTC) bulls tried to push the price above $85,000, but the bears held their ground. A minor positive is that larger investors seem to be accumulating at lower levels.
Research firm Santiment said in a post on X that wallets with 10 BTC or more have bought roughly 5,000 Bitcoin since March 3. The researchers added that if buying by the large players continues, the second half of March could be much better than the recent performance of Bitcoin.
However, not everyone is bullish on Bitcoin in the near term. BitMEX co-founder and Maelstrom chief investment officer Arthur Hayes said in a post on X that Bitcoin could retest $78,000 and even below $75,000.
He added that Bitcoin’s price action could become violent if it drops in the $70,000 to $75,000 zone as a lot of Bitcoin open interest is stuck in that range.

Daily cryptocurrency market performance. Source: Coin360
Meanwhile, short-term investor sentiment remains bearish. According to CoinShares data, cryptocurrency exchange-traded products (ETPs) witnessed $876 million in outflows last week, taking the four-week total outflows to $4.75 billion. Bitcoin ETPs recorded the lion’s share of outflows at $756 million.
Can Bitcoin start a recovery from the current levels, pulling altcoins higher? Let’s analyze the charts to find out.
S&P 500 Index price analysis
The S&P 500 Index (SPX) turned down from the 20-day exponential moving average (5,900) on March 3 and broke below the 5,773 support on March 6, completing a double-top pattern.

SPX daily chart. Source: Cointelegraph/TradingView
The index bounced off the 5,670 level on March 7, but the bears successfully defended the breakdown level of 5,773. The index turned down and broke below the 5,670 support on March 10, opening the doors for a fall to 5,400.
Buyers will have to push and sustain the price above 5,773 to suggest solid demand at lower levels. The index could then rise to the 20-day EMA, which is again expected to act as a strong resistance.
US Dollar Index price analysis
The US Dollar Index (DXY) turned down sharply on March 3 and continued lower, breaking below the 105.42 support on March 5.
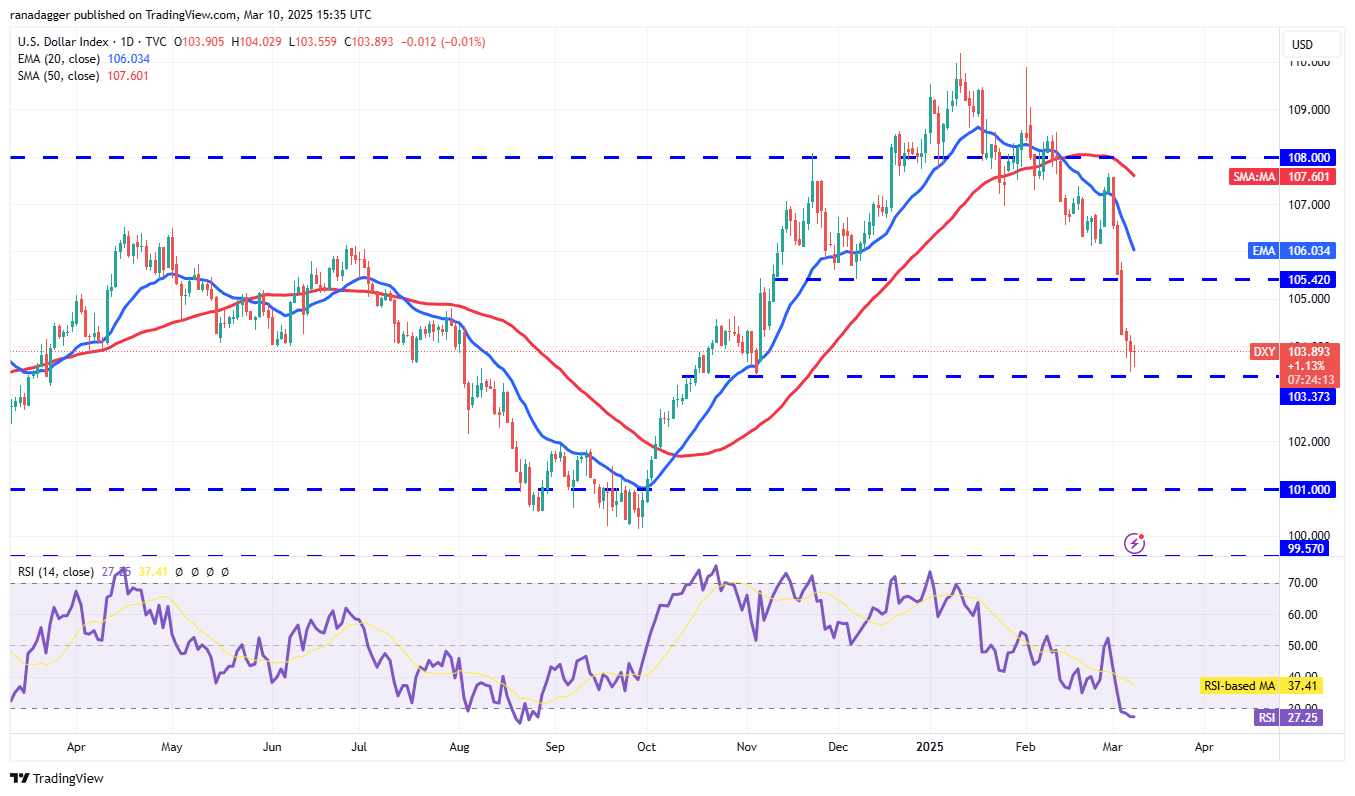
DXY daily chart. Source: Cointelegraph/TradingView
The fall below 105.42 suggests that the breakout above 108 may have been a bull trap. Buyers are trying to defend the 103.73 level, but the relief rally is expected to face selling at the 20-day EMA (106.03).
If the price turns down from the current level or the 20-day EMA, it will suggest a negative sentiment. That…
Click Here to Read the Full Original Article at Cointelegraph.com News…