- Solana shows signs of recovery but must break $150 and $152.50 resistances.
- Solciety (SLCTY) meme coin launches June 18, merging politics and memes.
- Solciety’s presale offers increasing prices, aiming to engage early investors.
Solana (SOL) has experienced significant price fluctuations recently, drawing attention from investors and analysts alike. Amid the price fluctuations, the upcoming launch of a new meme coin, Solciety (SLCTY), on the Solana blockchain has caught the attention of the community eager to see if it will reenergize the cryptocurrency.
In this article we shall delve into Solana’s recent price movements, technical analysis, and price prediction, as well as provide an in-depth look at the Solciety (SLCTY) meme coin.
Solana (SOL) price shows recovery signs after a prolonged drop
Solana (SOL) has been on a roller-coaster ride over the past month, experiencing a notable decline. Over the last week, the price of Solana dropped by more than 7% adding to the 12% drop over the past month.
Recently, SOL broke below the critical $150 support level, a move that concerned many investors as this level was both a technical and psychological support. The breach of this level led to further bearish sentiment, indicating a continued downward trend.
Despite these challenges, there are emerging signs of recovery. At press time, Solana (SOL) was trading at $146.81, showing a modest increase of 1.36% over the past 24 hours.
This slight uptick comes after SOL tested the $138 zone and began a recovery wave. Key resistance levels for Solana price to establish a clear upward trend are at $150 and $155. If SOL manages to break and hold above these levels, it could set the stage for a steady increase.
Technical analysis reveals a connecting bullish trend line with support at $146 on the hourly chart of the SOL/USDT pair. The price has managed to climb above the 100-hourly simple moving average and the $145 resistance level.
Looking at the technical indicators, the daily MACD for SOL/USDT is showing signs of a cross over with the MACD histogram moving towards the bullish zone. In addition, the daily RSI is nearing the 50 level up from the oversold region, indicating a balanced momentum but potential volatility ahead.
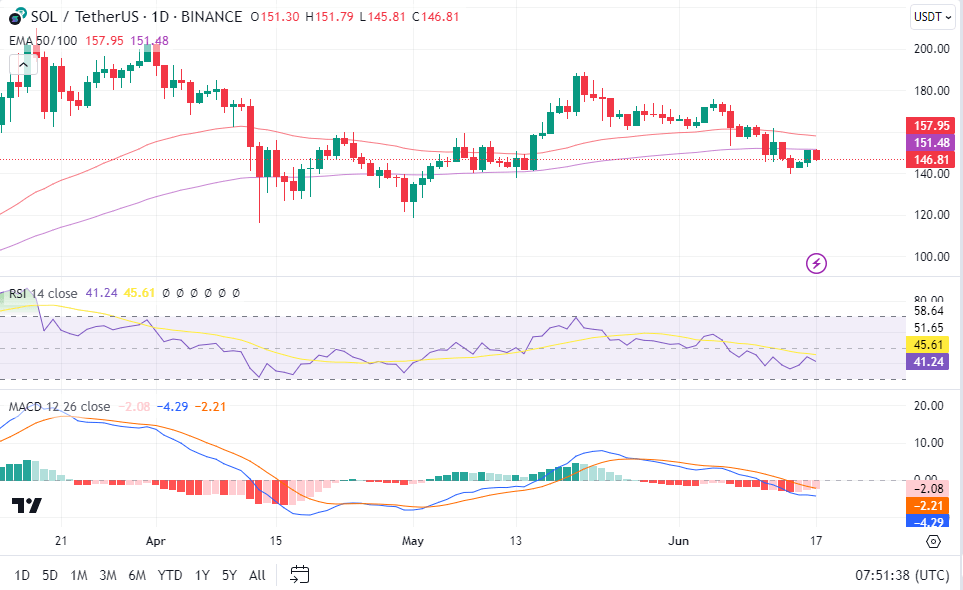
Immediate resistance is near the $150 mark, with significant resistance at $152.50 and $156.50. Should SOL successfully close…