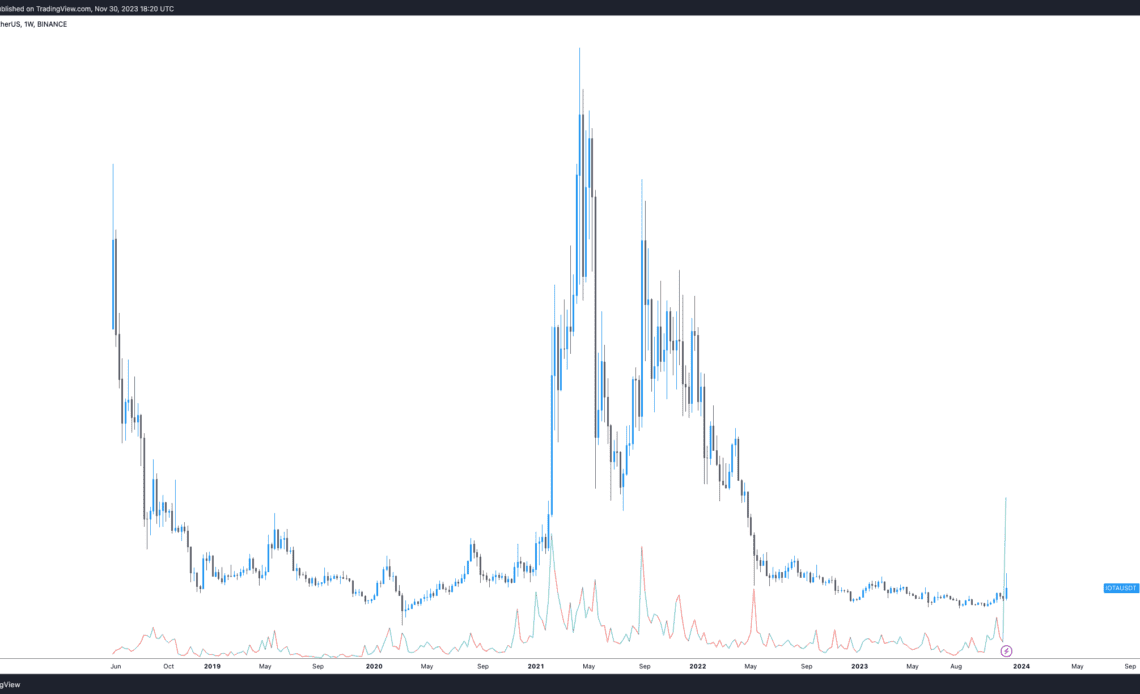
IOTA, an open-source distributed ledger and cryptocurrency focused on the Internet of Things (IOT), saw its native IOTA token rally 43% on Nov. 29 after announcing the creation of the Iota Ecosystem DLT Foundation and its registration in Abu Dhabi, the capital of the United Arab Emirates. This makes IOTA the first DLT foundation to be regulated by the Abu Dhabi Global Market (ADGM).
According to a press release from the project, the foundation will be seeded with $100 million in IOTA tokens, which will be vested over a four-year period and traders clearly perceived the announcement and funding plan as a short-term bullish catalyst.
Historically, ecosystem and developer incentives by blockchain and DeFi protocols tend to attract liquidity to the project and boost market participant sentiment.
In August 2021, Avalanche’s AVAX token went on a 1,400% tear after the announcement of the Avalanche Rush DeFi incentive program.
A similar outcome was seen with Trader Joe’s JOE token in the months following December 2022 after the DeFi protocol announced plans to establish a presence on Arbitrum.
Currently, the Arbitrum ecosystem is hosting liquidity and developer incentives and these initiatives align with the recent 62% resurgence in ARB token price.
Was IOTA’s price move another sell-the-news event?
On Nov. 30, crypto derivatives data provider Coinalyze tweeted the following IOTA chart, noting that IOTA’s “funding rate and long/short ratio” were at a “historical low.”
Funding Rate and Long/Short ratio at historical low! pic.twitter.com/wloZNoLMxu
— Coinalyze (@coinalyzetool) November 30, 2023
Traders often interpret funding rates and longs-to-shorts ratios as sentiment gauges and indicators of how active investors are positioned. Within this context, traders perceive a low funding rate to reflect a crowded short position and in these situations, a positive news or price event can quickly catalyze a swift price reversal that squeezes short traders out of their position.
Comparing Coinalyze’s chart to a standard candlestick daily chart appears to reflect this dynamic, especially the high volume buy candle on Nov. 29.
Beyond the most recent price breakout, IOTA price was trading at a multi-year low and on the weekly timeframe, the chart reflects a certain degree of disinterest in the project from a traders’ perspective.
Cryptocurrencies have a long history of seeing price spikes leading into…
Click Here to Read the Full Original Article at Cointelegraph.com News…
