Bitcoin (BTC) traded in a narrow range this week and is on target to form the third consecutive Doji candlestick pattern on the weekly chart. The cryptocurrency markets did not receive any support from the United States equities markets, which ended the week on a negative note. The S&P 500 Index dropped 1.3% while the Nasdaq closed down 1.9%.
Bitcoin’s weakness has dragged several altcoins lower, with many testing multi-week lows. This indicates that the broader crypto market is in a firm bear grip. Negative markets make it difficult for buyers to identify short-term bullish trades as rallies hardly sustain. However, it could be a good time for long-term investors to build a portfolio.
According to a recent Amberdata report, 24% of asset management firms are appointing senior executives dedicated to the implementation of digital strategies. Down the line, 13% more firms plan to adopt a digital assets strategy. This indicates “seriousness about implementation as well as senior management buy-in,” the report added.
Could Bitcoin break out to the upside, boosting buying interest in altcoins? Let’s study the charts of top-5 cryptocurrencies that are showing promise in the near term.
Bitcoin price analysis
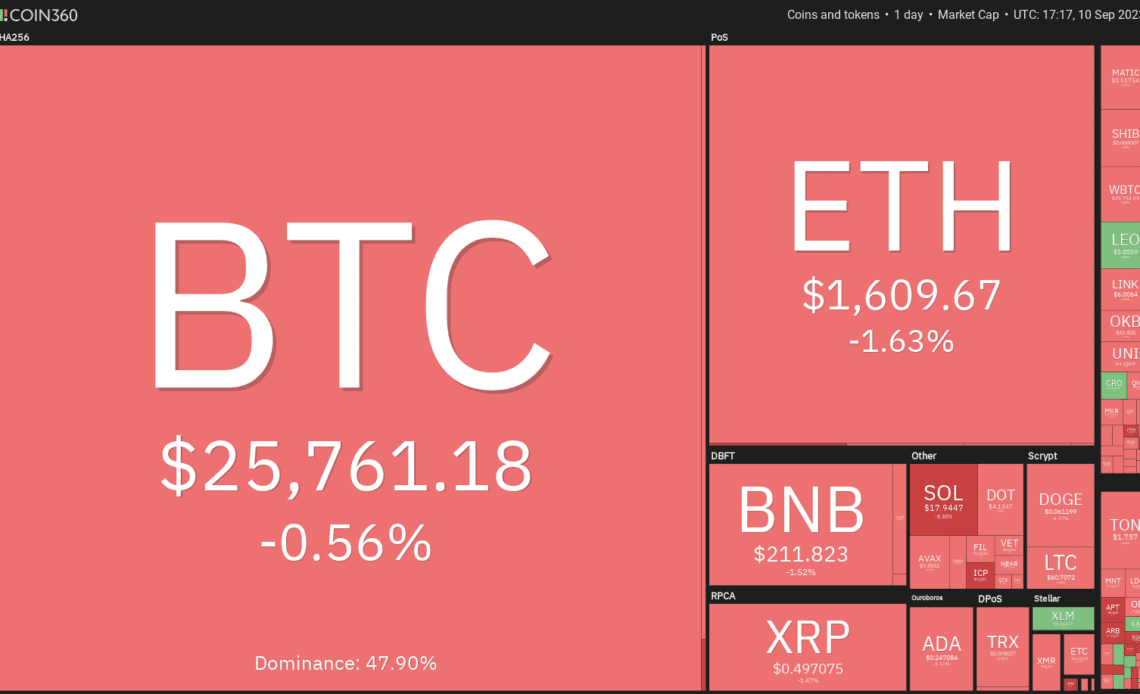
Bitcoin has been trading near the $26,000 level for the past few days, indicating a tussle between the bulls and the bears.
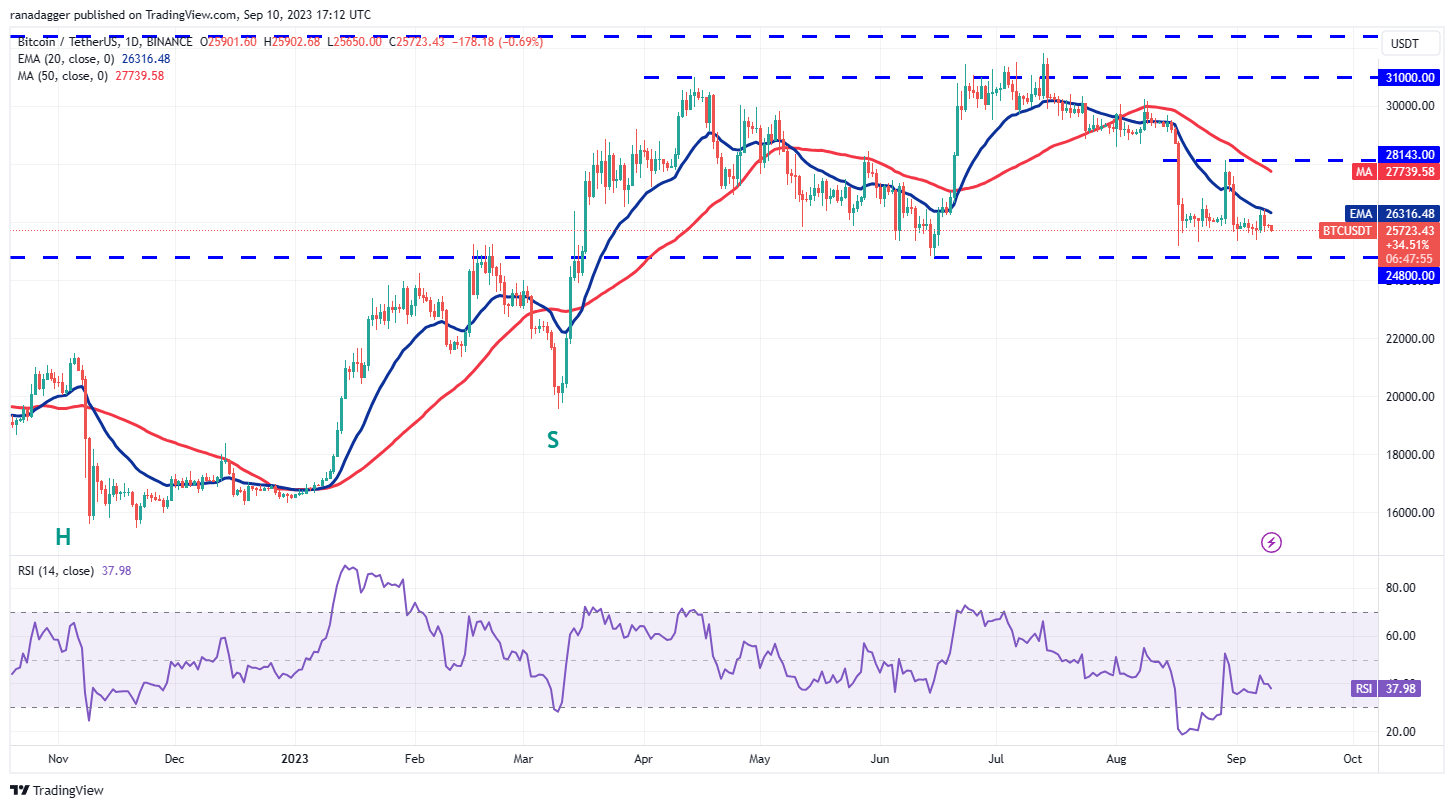
The downsloping moving averages indicate advantage to bears but the positive divergence on the relative strength index suggests that the selling pressure is reducing. The indicators are not giving a clear advantage either to the bulls or the bears.
Therefore, it is better to wait for the price to either sustain above $26,500 or dive below $24,800 before placing large bets.
If bulls overcome the obstacle at $26,500, the BTC/USDT pair could soar to the overhead resistance at $28,143. On the other hand, a fall below $24,800 could clear the path for a collapse to $20,000.
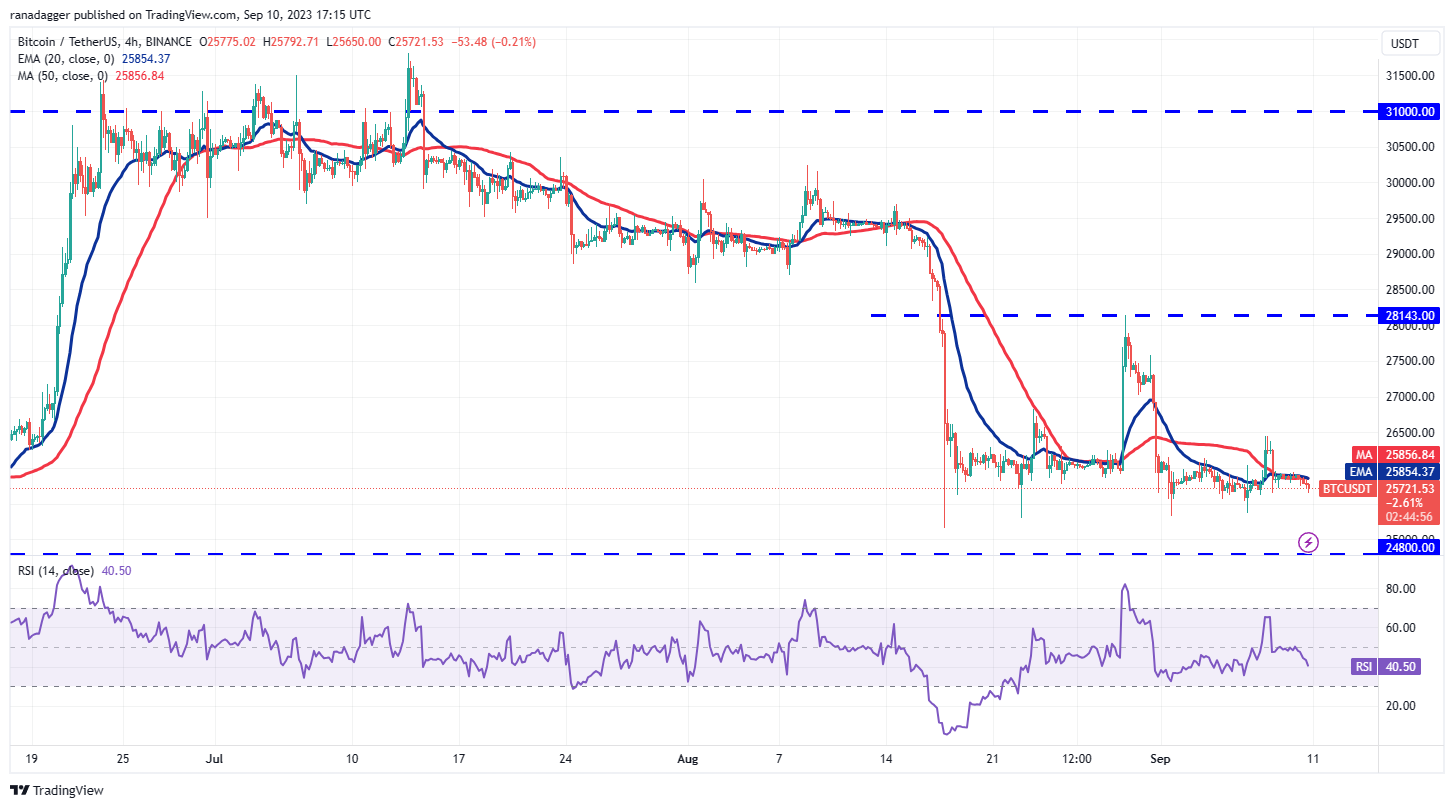
The price has been trading near the moving averages on the 4-hour chart, indicating a lack of interest from both the bulls and the bears. This tight-range trading is unlikely to continue for long and may lead to a range expansion within the next few days.
On the upside, a rally above $26,500 will indicate that the advantage has tilted in favor of the buyers. That may start an up-move to $27,600 and eventually to $28,143.
Alternatively, if the…
Click Here to Read the Full Original Article at Cointelegraph.com News…