The latest report from Glassnode Insights, titled “The Week On-Chain,” emphasized that Bitcoin (BTC) has reached historically low levels of volatility. This has led to a mere 2.9% separation between the asset’s Bollinger Bands, indicating an exceptionally narrow trading range.
This situation has only been observed twice in Bitcoin’s history: in September 2016, when BTC traded near $604, and in January 2023, when the asset maintained a steady value of $16,800.
As outlined in the report, periods of reduced volatility, combined with investor fatigue, prompt the movement of coins based on their cost close to the current price. This implies that traders are likely making marginal profits or losses with their exits. The report concludes that establishing a new price range is necessary to stimulate fresh spending, potentially contributing to an anticipated increase in volatility.
Is Bitcoin’s low volatility a reflection of broader markets?
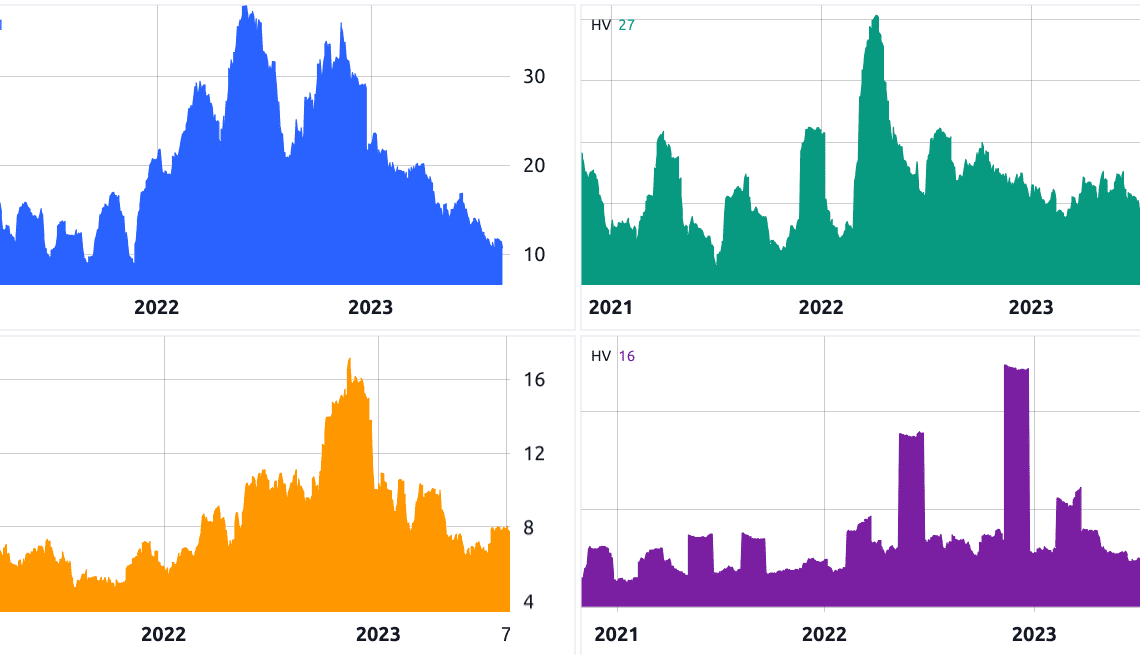
The constrained range within which Bitcoin has traded – specifically, $29,050 to $29,775 over the past three weeks – is atypical and it does not require advanced mathematical analysis to understand. This has resulted in an exceptionally low annualized 30-day volatility of 17%. The key question is whether this trend is isolated to cryptocurrencies, or if it’s a phenomenon also observed in the traditional markets, including stocks, oil, bonds and currencies.
Notice how the S&P 500 and oil price (WTI) 30-day volatility are currently at their lowest levels since November 2021. Interestingly, the DXY index didn’t follow this trend, as the metric rose to 8% from 6% in May 2023. Additionally, the 10-year Treasury yield recently rose from its 18-month low of around 10% to the current 16%. These trends could have potentially influenced the decrease in Bitcoin’s volatility.
According to Glassnode, there’s a significant concentration of short-term holders’ price distribution between $25,000 and $31,000. This pattern is reminiscent of similar periods during past bear market recoveries. However, the data shows that many of these investors are still holding positions with losses, creating short-term selling pressure.
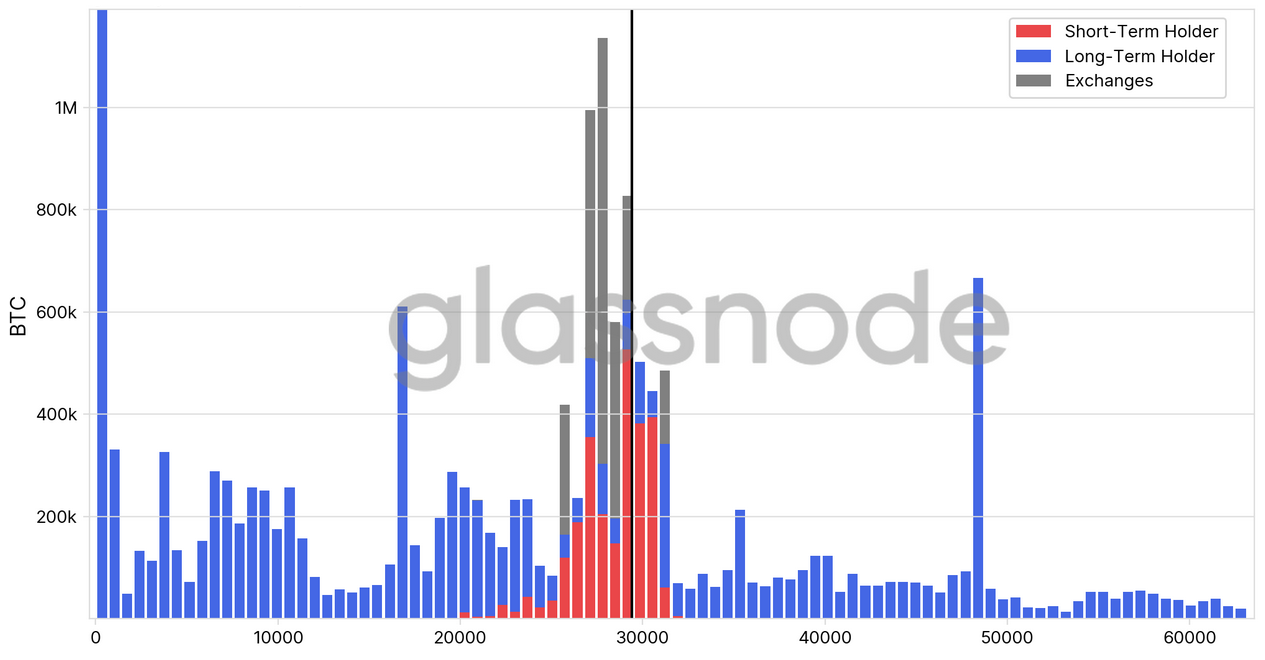
Moreover, the analytics firm highlights a noteworthy drop in short-term holder supply to a multi-year low of 2.56 million BTC. On the flip side,…
Click Here to Read the Full Original Article at Cointelegraph.com News…