Bitcoin (BTC) is on track to form two successive Doji candlestick patterns on the weekly charts but a positive sign is that the price is sustaining above the 20-week exponential moving average ($28,072). This suggests that the bulls have not lost their grip.
Popular trader TechDev used the three-week timeframe to show that Bitcoin’s compression above the 20-period moving average was approaching values seen only four times since Bitcoin’s creation. Interestingly, on all three previous occasions, the expansions happened to the upside, suggesting that history favors the bulls.
However, in the near term, the lack of volatility has pulled Bitcoin futures trading volumes to their lowest levels since December 2022. Cointelegraph contributor Marcel Pechman believes this shows that traders may have shifted to other markets or maybe avoiding making moves at the current levels.
While several altcoins are looking to Bitcoin for direction, some have outperformed in the near term. Let’s study the charts of the top-5 cryptocurrencies that are looking positive over the next few days.
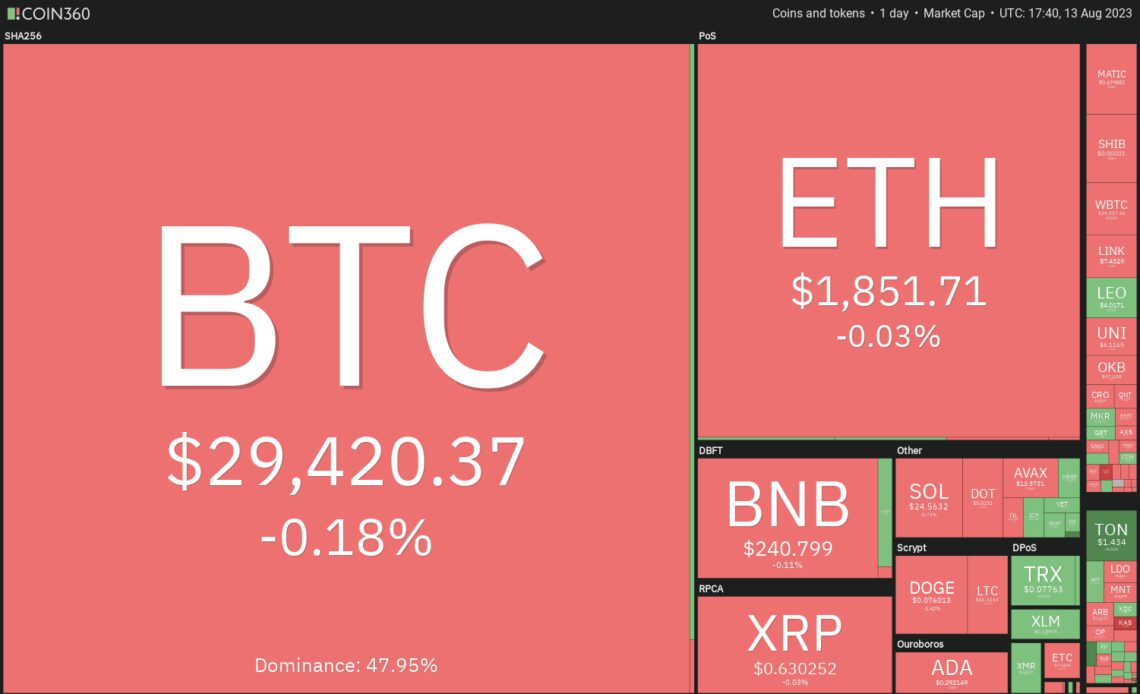
Bitcoin price analysis
Bitcoin has been trading near the 20-day EMA ($29,447) for the past two days, signaling indecision between the bulls and the bears.
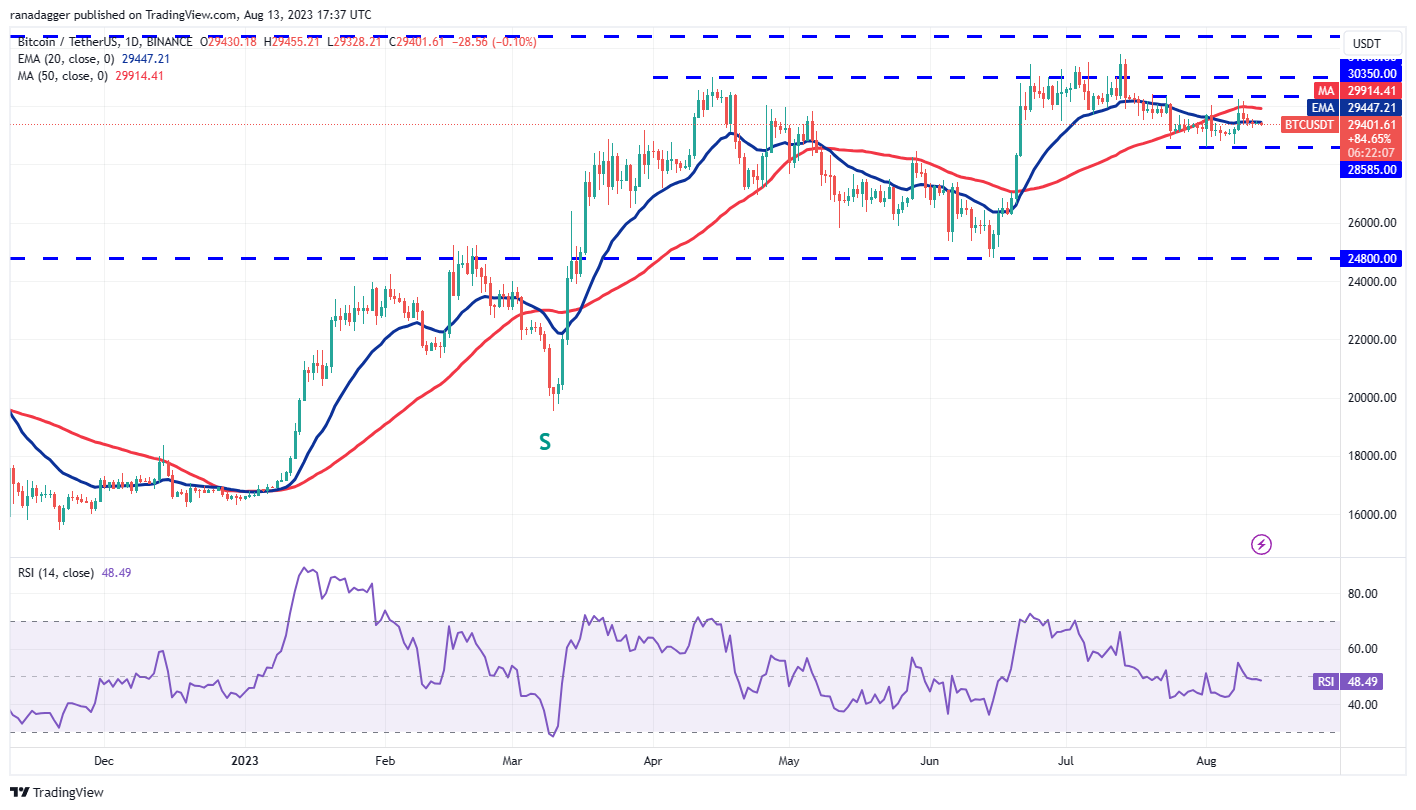
The flattish moving averages and the relative strength index (RSI) near the midpoint do not give a clear advantage either to the bulls or the bears. That could keep the BTC/USDT pair stuck inside the $28,585 to $30,150 range for a while.
The next trending move is likely to begin after the price escapes this range. If the price dives below $28,585, the selling could pick up momentum and the pair may dump to $26,000.
On the upside, a break and close above $30,150 may attract buyers. The pair could then surge to the $31,804 to $32,400 resistance zone.
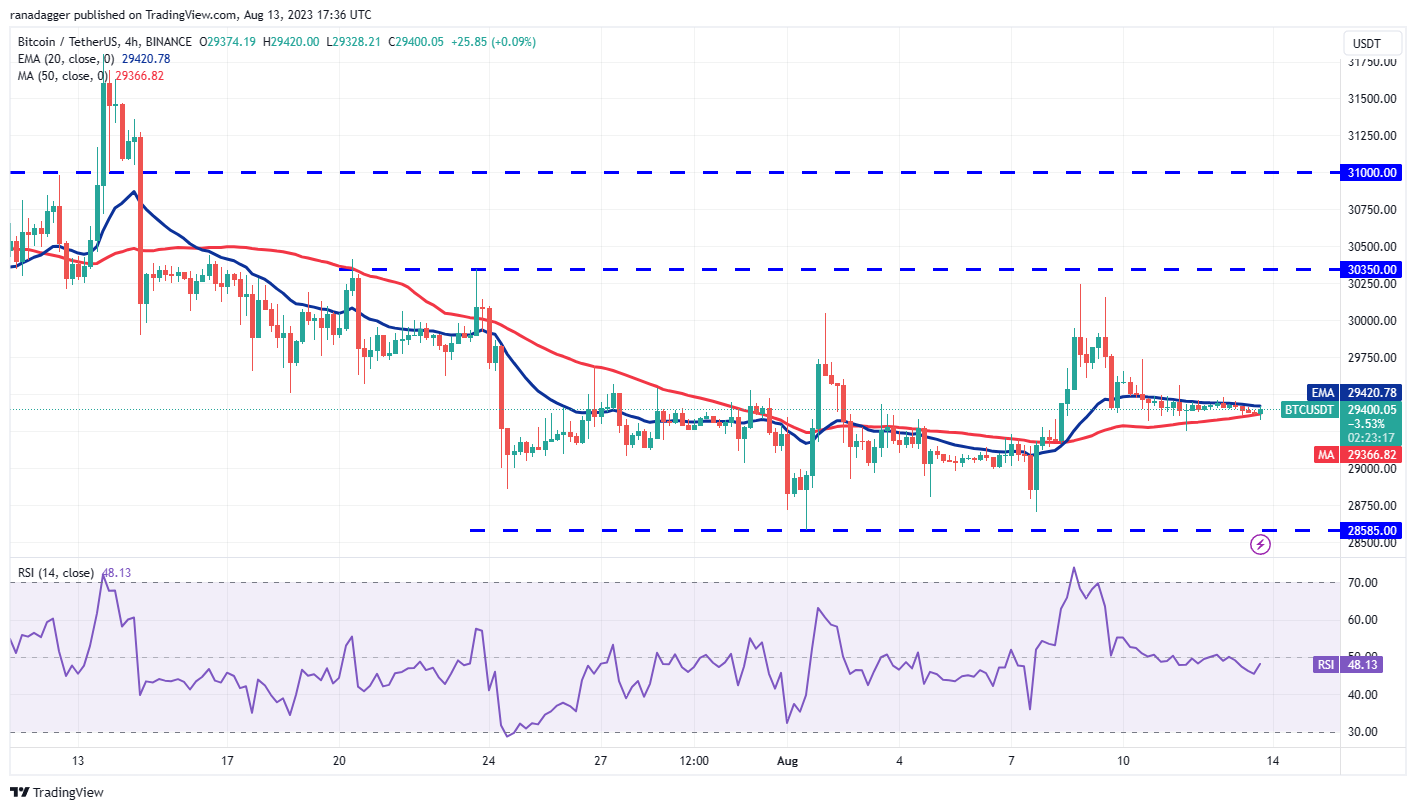
The 4-hour chart shows that the price is stuck between the moving averages, suggesting uncertainty about the next trending move. If the price closes below the 50-simple moving average, the short-term advantage will tilt in favor of the bears. That could drag the price toward $29,000 and then to $28,585.
If the price turns up and breaks above the 20-EMA, it will suggest that the bulls are trying to seize control. The pair may first rise to $29,738 and if this hurdle is cleared, the rally could reach the overhead resistance at $30,350.
Shiba Inu price analysis
Shiba Inu (
Click Here to Read the Full Original Article at Cointelegraph.com News…