Polygon (MATIC) price is up today, mirroring upside moves elsewhere in the cryptocurrency market as traders assess a mix of fundamental factors.
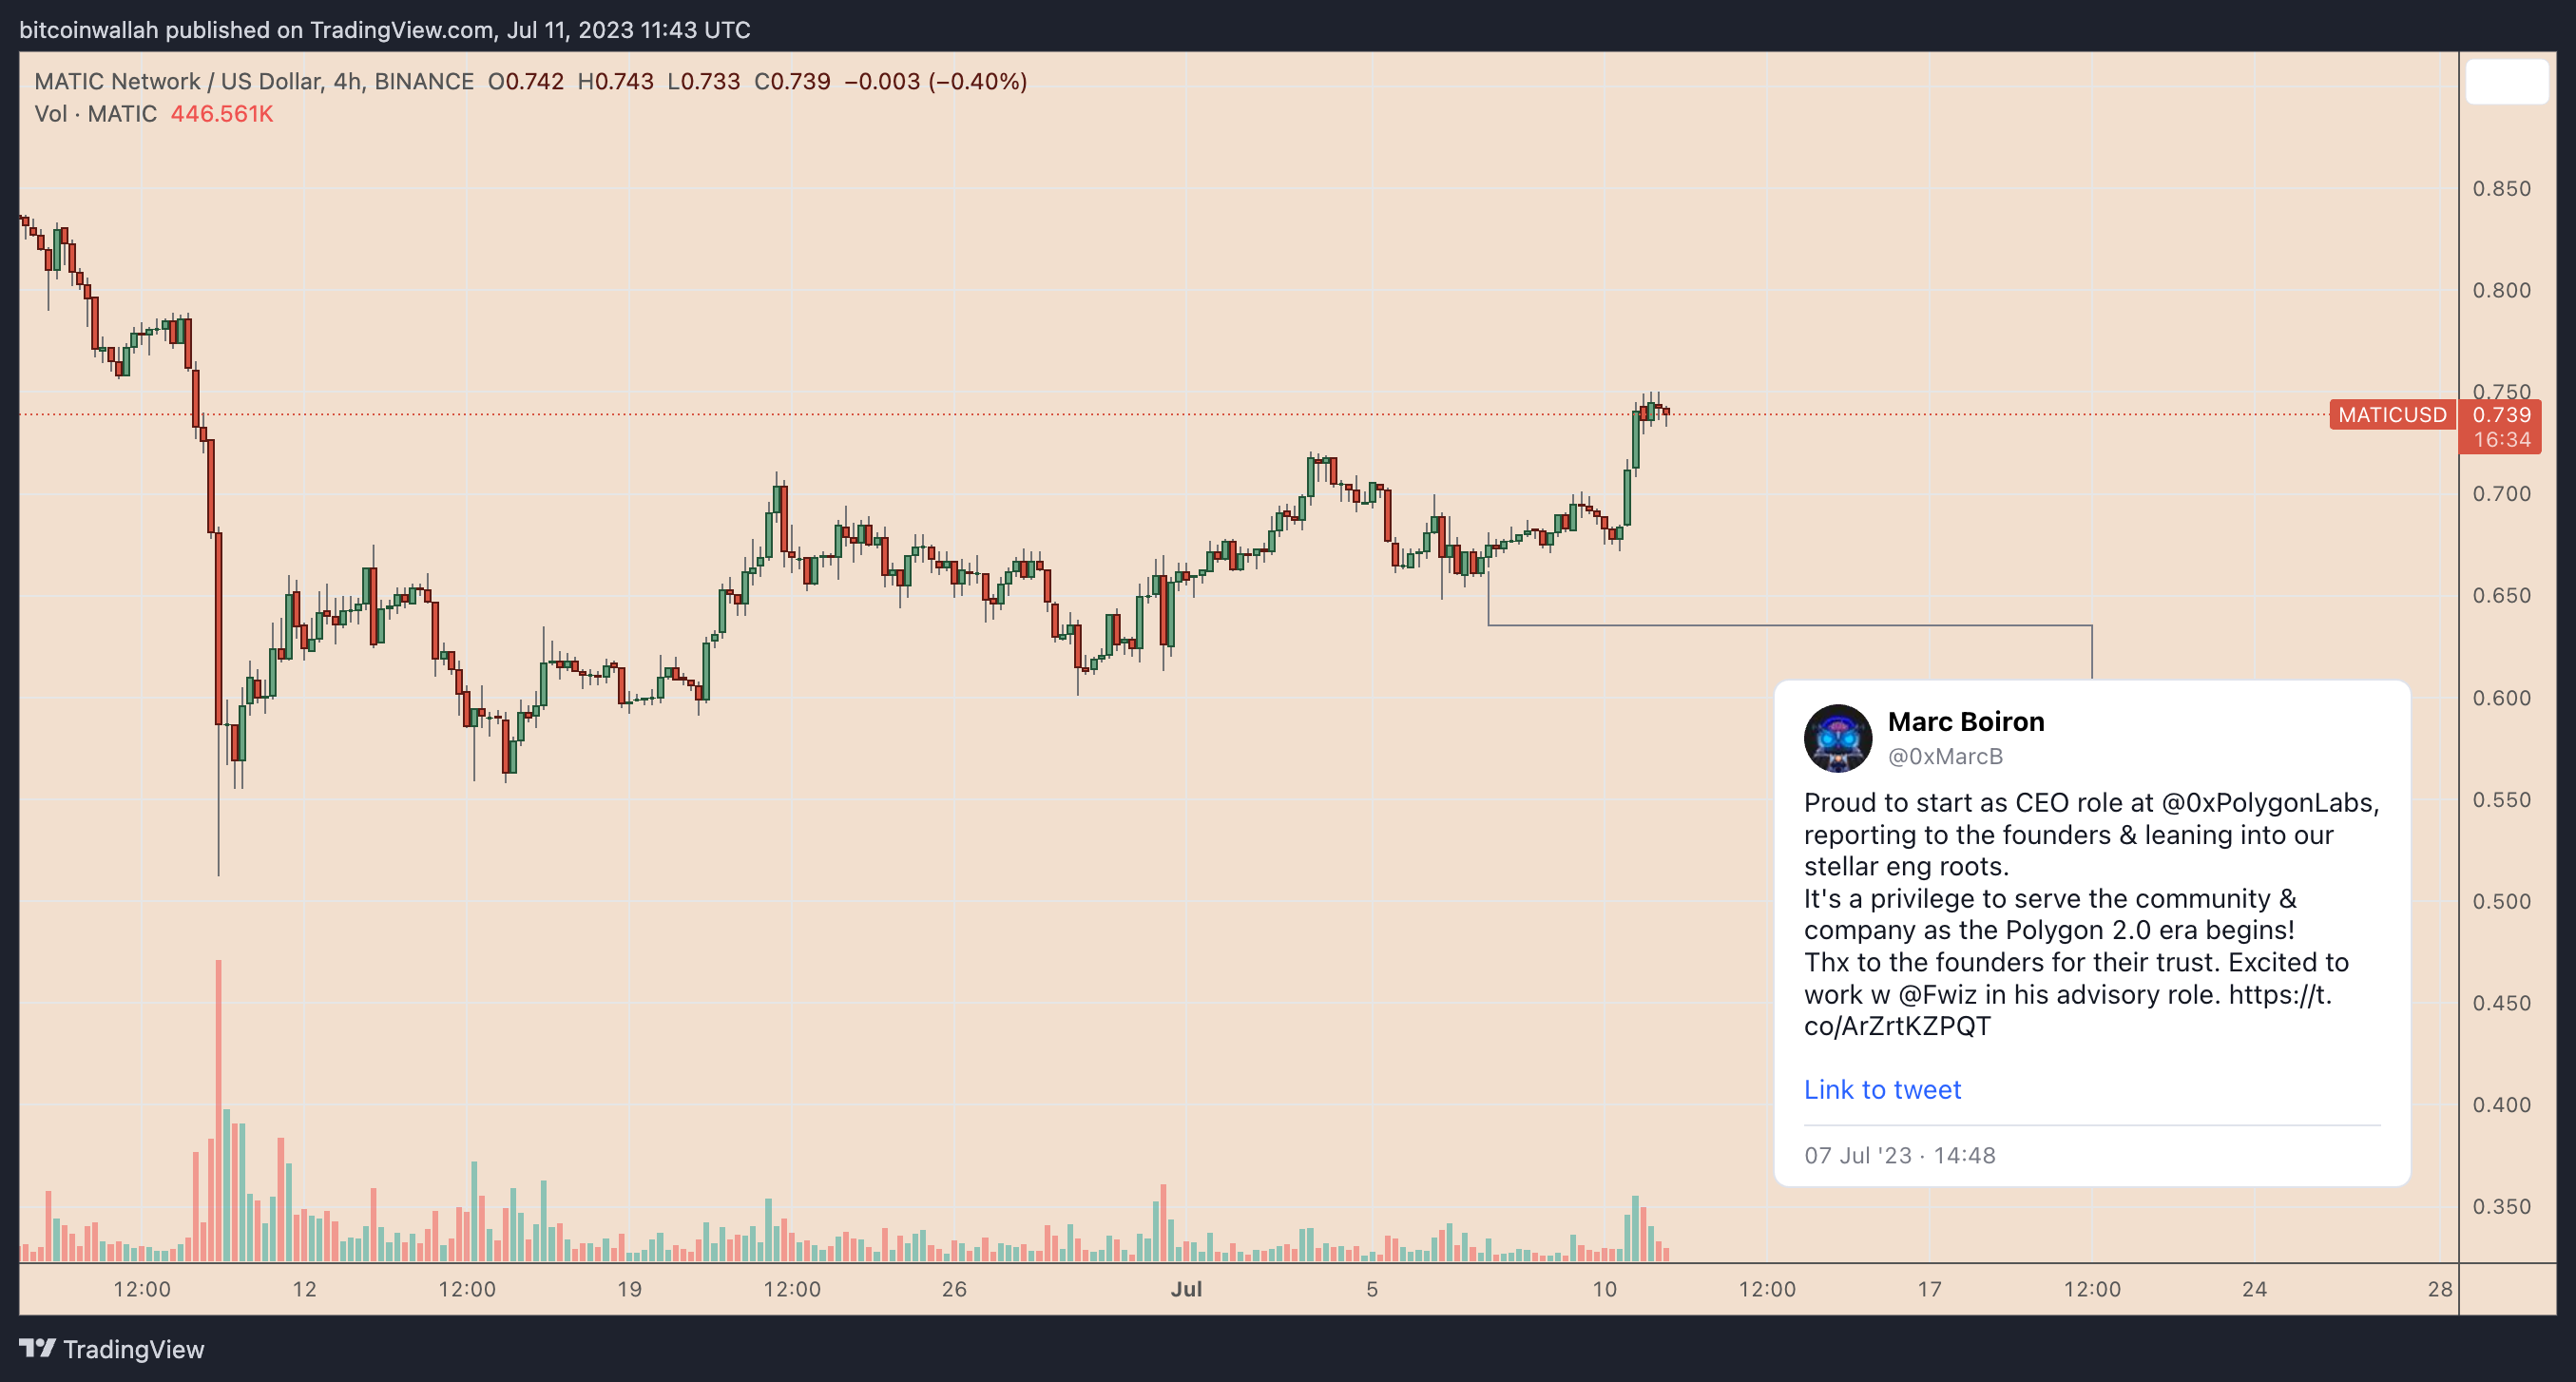
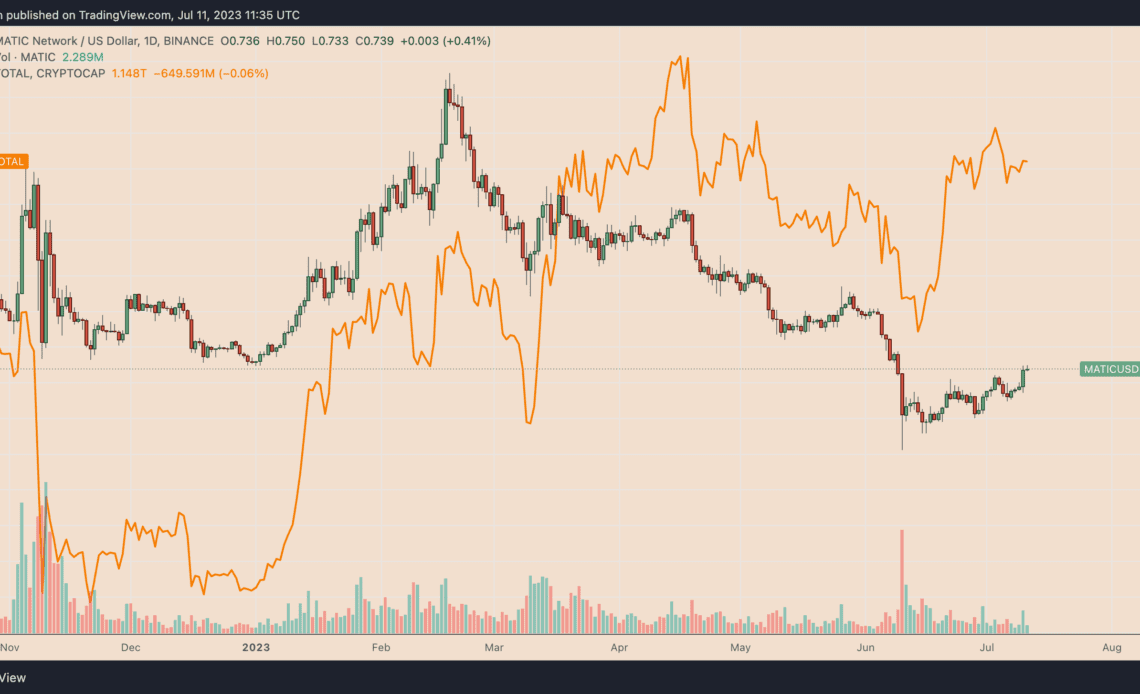
On July 11, the MATIC price rose 2.32% to $0.75, its highest level in a month — outperforming the crypto market, whose valuation stayed relatively unchanged from the previous day at around $1.14 trillion.
New CEO, Polygon’s ‘decentralized governance’ plans
MATIC’s intraday gains come as a part of a broader price jump that started after Polygon appointed its former chief legal office, Marc Boiron, as the new chief executive officer (CEO) on July 7. Since then, MATIC/USD has gained nearly 15%.

Boiron’s appointment comes more than a month after the U.S. Securities and Exchange Commission (SEC) argued that MATIC is a “security” in its lawsuits against Binance and Coinbase.
Meanwhile, the price gains also appear as Polygon prepares to implement a sequence of network upgrades as a part of its “Polygon 2.0” overhaul. Namely, the establishment of a “decentralized governance” protocol by July 17.
MATIC whales get bigger
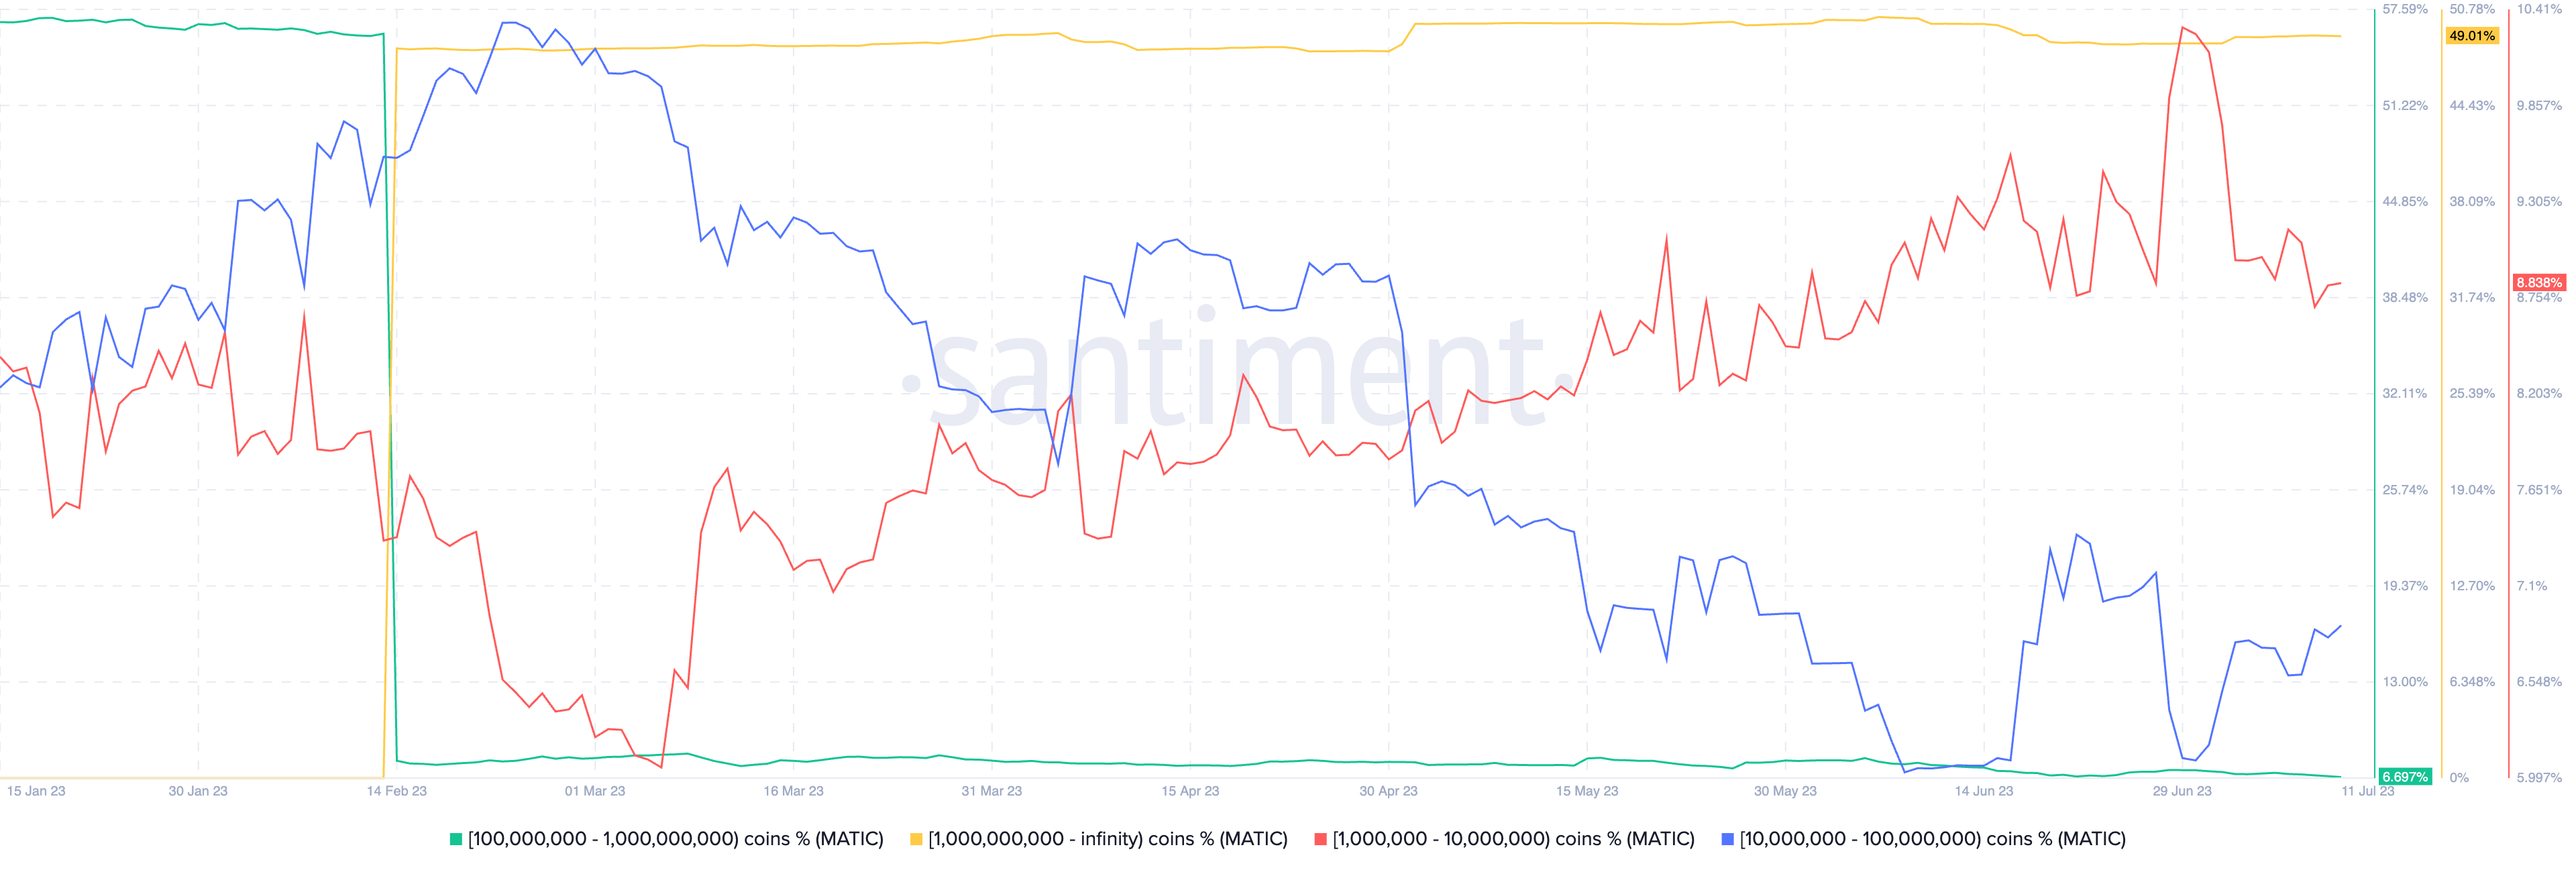
MATIC’s price rally on July 11 succeeds a period of strong whale accumulation.
For instance, the supply of MATIC held by entities with balance between 10 million and 100 million tokens has increased by more than 1% in July so far.

That coincides with a drop in the supply held by the 1 million-10 million MATIC cohort. In other words, some whales from the 1 million-10 million MATIC cohort accumulated tokens in July and became part of the 10 million-100 million MATIC cohort.
MATIC’s July outlook
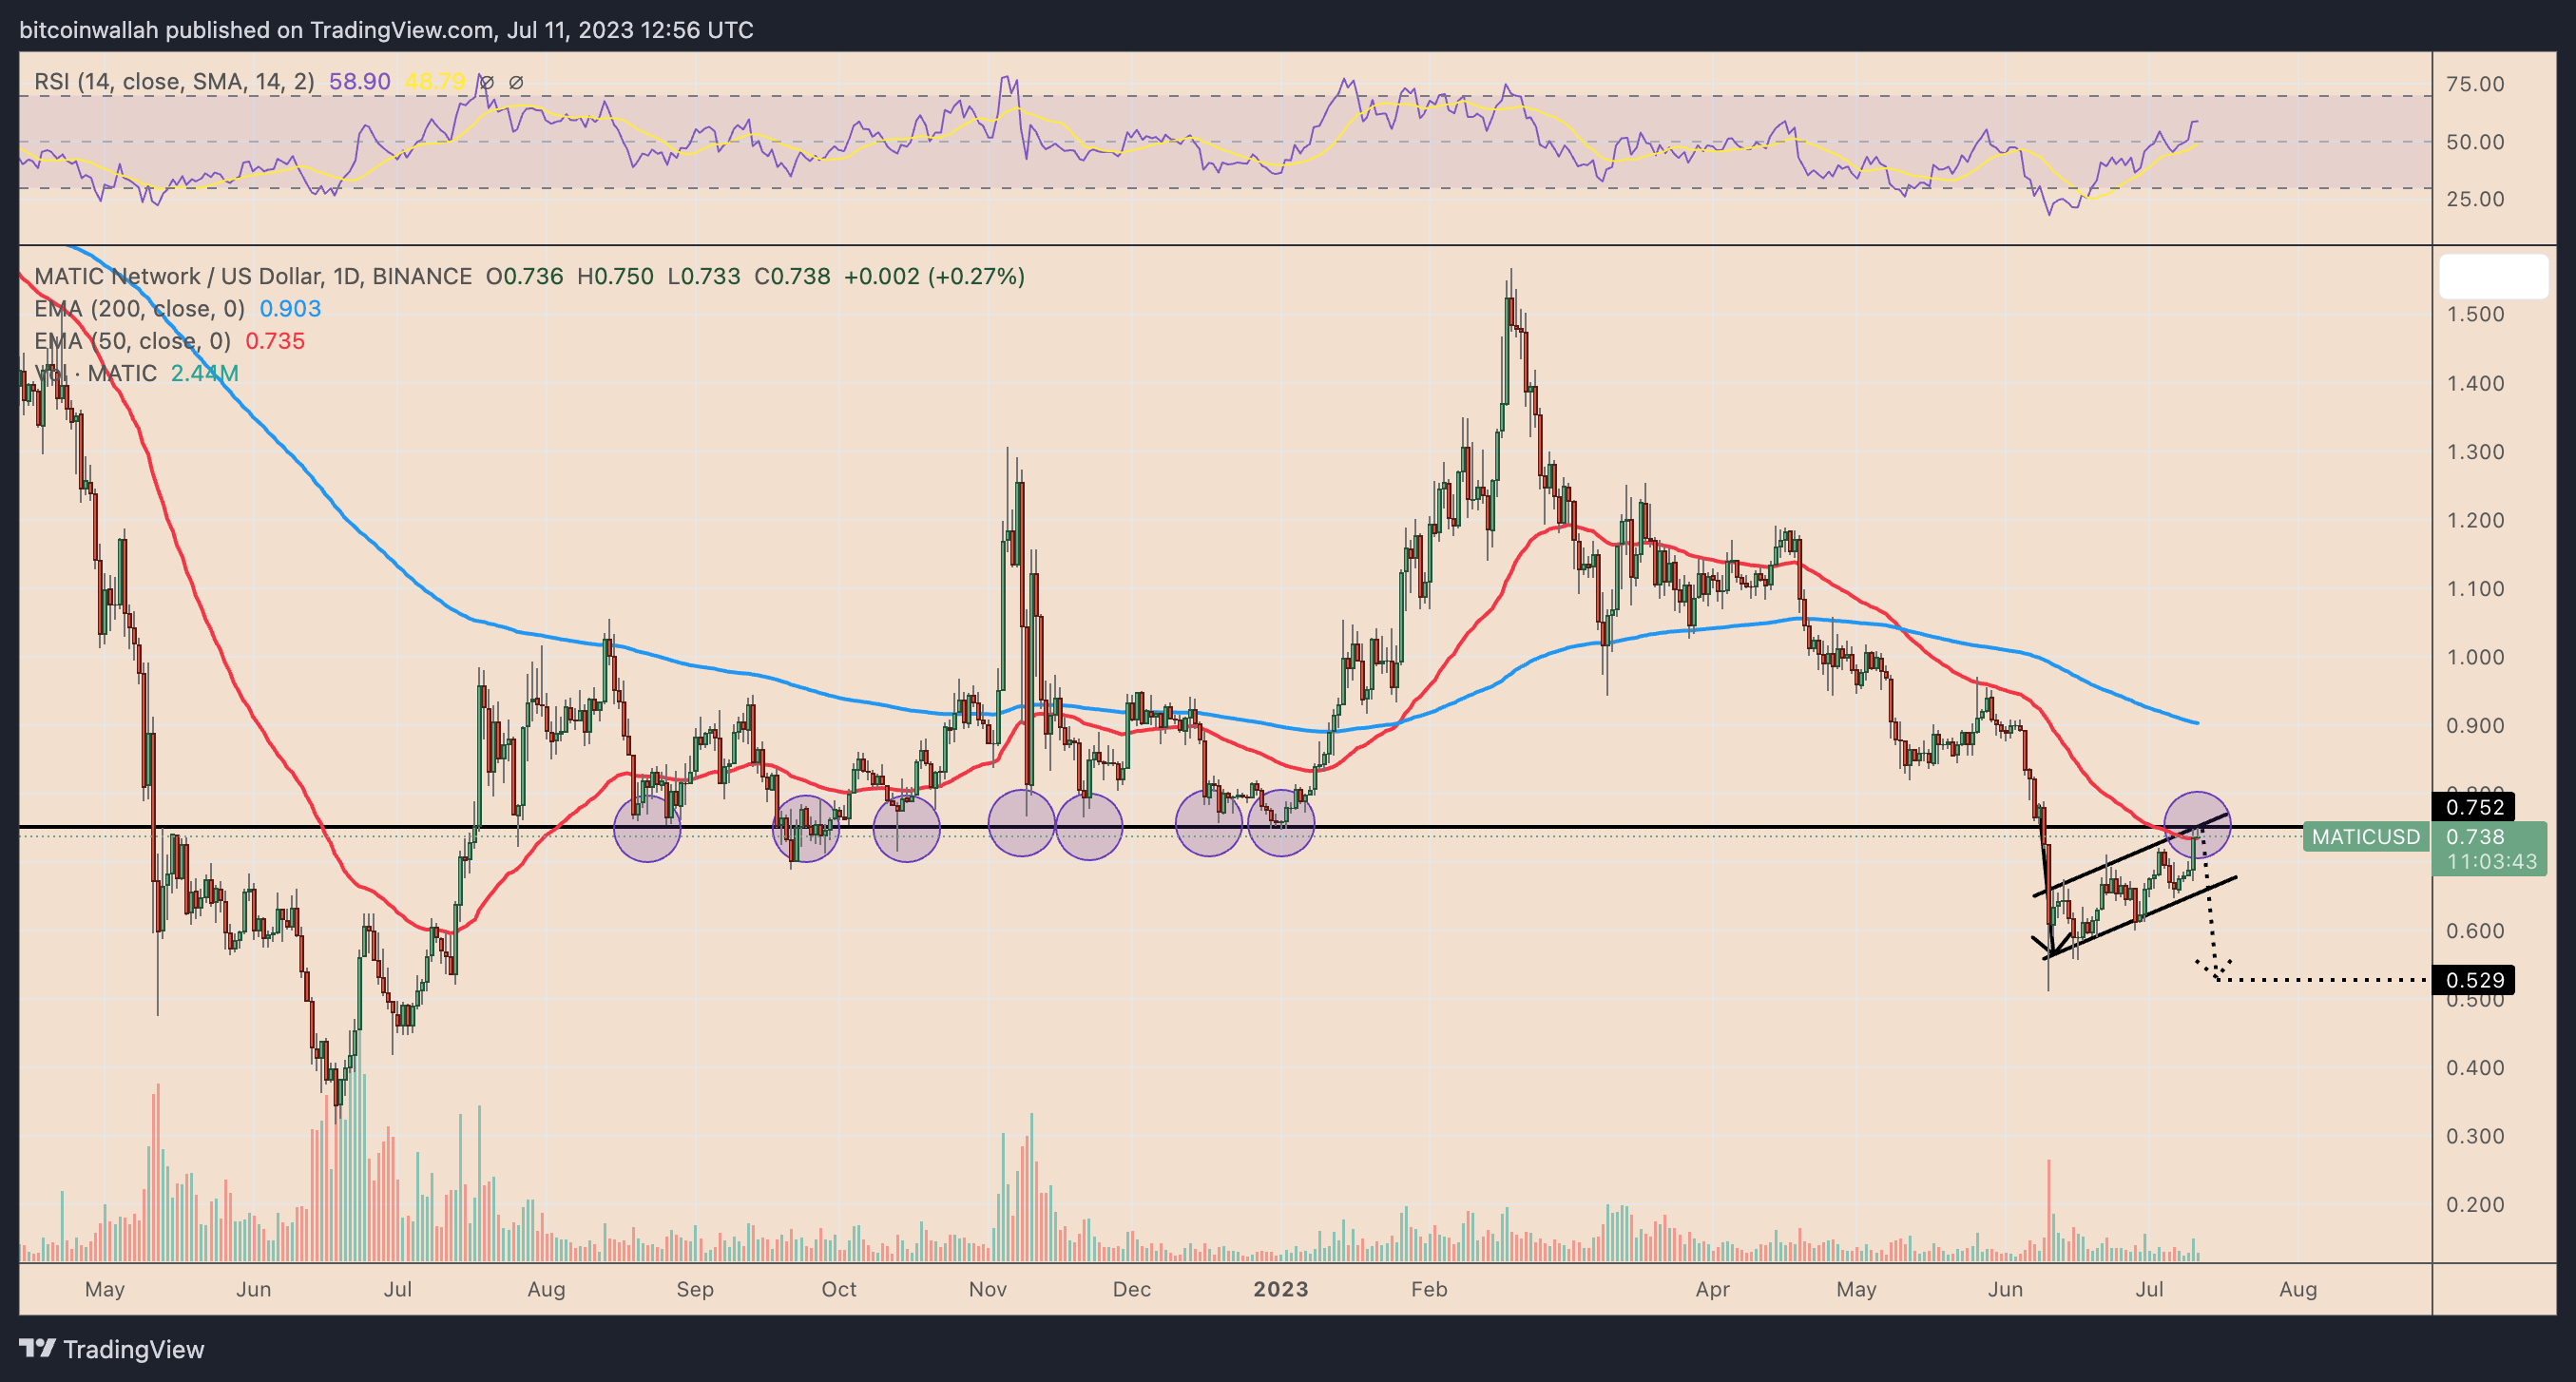
From a technical perspective, MATIC looks prepared to undergo sharp price declines in July.
As of July 11, the Polygon token was testing a resistance confluence comprising its 50-day exponential moving average (50-day EMA; the red wave), a support-turned-resistance horizontal trendline, and an ascending trendline constituting a potential bear flag pattern.

A pullback from the resistance confluence risks sending the price toward the flag’s lower trendline near $0.68 in July, down about 10% from current price levels.
Related: Polygon 2.0 introduces upgrades to tap into ‘Value Layer’ of internet
Moreover, a close below the lower trendline will increase the potential of triggering a bear flag…
Click Here to Read the Full Original Article at Cointelegraph.com News…
