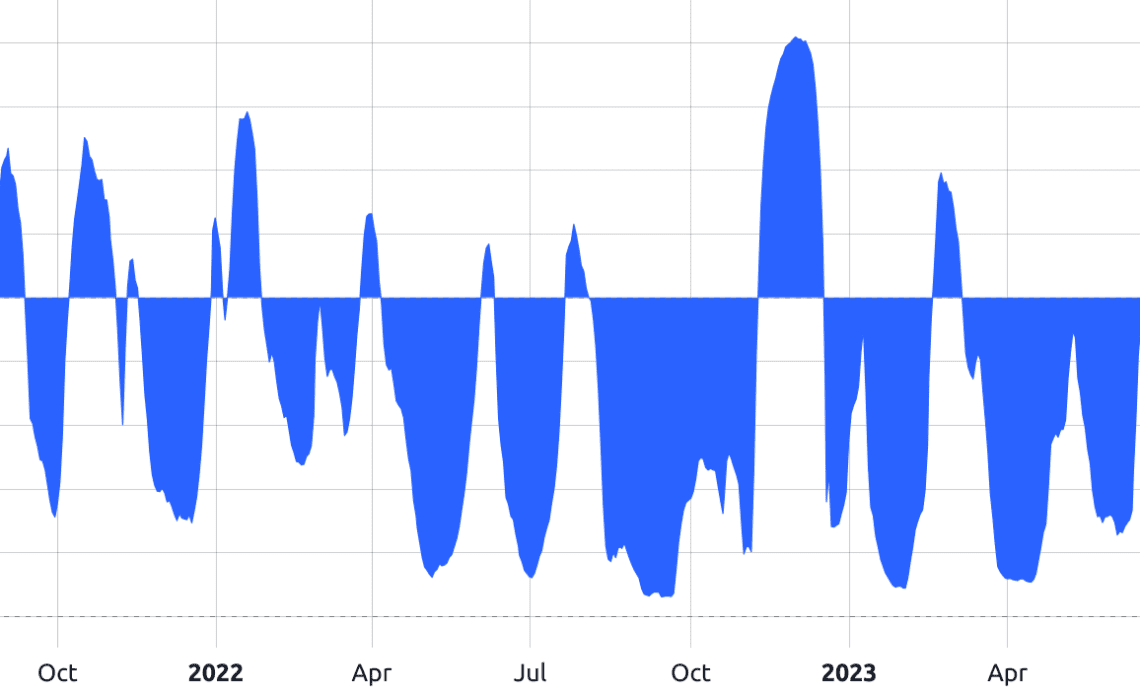
There is a common belief that when the U.S. dollar declines relative to other main global currencies, as measured by the Dollar Strength Index (DXY), the impact on Bitcoin (BTC) is positive, and vice versa.
For instance, the DXY index dropped from 103.0 on Jan. 2017 to a 92.6 low on Aug. 2017, while Bitcoin rallied from $1,000 to $4,930 in the same period. But is there enough evidence to justify a bull run similar to 2016–17, as some analysts are arguing?
But is there enough evidence to justify a bull run similar to 2016–2017, as some analysts are arguing?
Is the Bitcoin-dollar inverse trend real?
Traders and influencers frequently warn about this negative correlation and how a reversal of DXY will likely push the Bitcoin price higher.
Investment research @GameofTrades_ recently posted a chart presenting the pattern in early 2023 and then repeating itself later in May. There’s some indisputable evidence of the inverse correlation there.
Bitcoin and DXY have maintained a negative correlation year-to-date in 2023 pic.twitter.com/VTePX3PNs6
— Game of Trades (@GameofTrades_) June 22, 2023
Moreover, technical analyst el_crypto_prof presents a bearish “Gaussian Channel” change on the DXY chart, which, according to the analysis, matched two previous bull runs for Bitcoin and altcoins in 2016–17 and 2020–21.
The DXY (US Dollar Index) has changed the color from green to red on the Gaussian Channel.
The last two times this happened, $BTC and Altcoins experienced a bullrun (parabola) in the following months (2016-2017 and 2020-2021).
Sounds exciting, doesn’t it? pic.twitter.com/kHJeM6iZDH
— ⓗ (@el_crypto_prof) June 26, 2023
BTC-DXY correlation varies with time
The seemingly inverse relationship between Bitcoin and DXY have never lasted more than 7 weeks. The correlation indicator runs from -100%, indicating that certain markets move in opposite ways, to 100%, indicating that the movement is in lockstep; 0 represents a total lack of correlation between the two assets.
The metric has been negative for 81% of the past 670 days, indicating that DXY and Bitcoin have generally followed an inverse trend. Still, that’s not how the correlation metric works, because readings between 0% and -50% denote a lack of correlation.
In fact, the longest-ever period of a correlation lower than -50% has been the 47 days starting on Aug. 18, 2022. Therefore, saying that Bitcoin has an inverse…
Click Here to Read the Full Original Article at Cointelegraph.com News…
