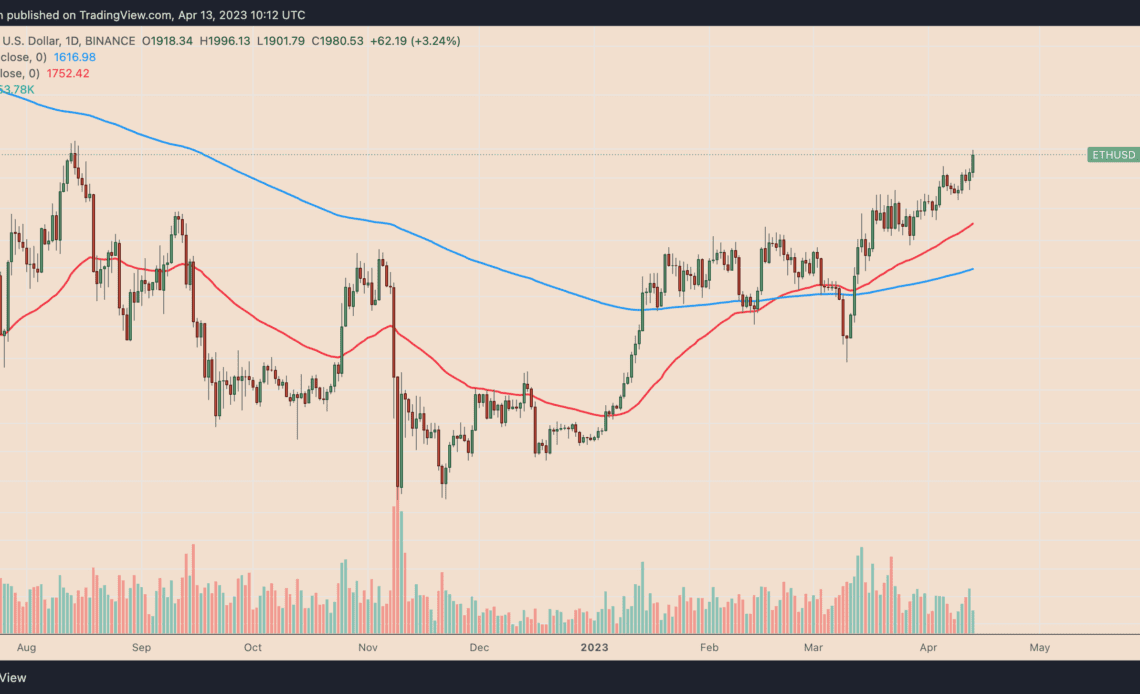
The price of Ethereum’s Ether (ETH) token came just a few dollars from hitting $2,000 a day after the launch of the network’s long-anticipated Shanghai upgrade.
Ethereum ducks sell-the-news fears
On April 13, Ether’s price gained roughly 4% to reach an intraday high of $1,996 on Coinbase, ignoring the potential selloff pressure the Shanghai upgrade could potentially bring to the market.
To recap: the Shanghai hard fork, also known as “Shapella,” enables users to withdraw their ETH from Ethereum’s proof-of-stake smart contract.
As of 09:00 UTC, April 13, over 98,000 ETH worth around $194.8 million has left Ethereum’s voting balance reserves since the Shanghai launch a day ago, according to Nansen. In other words, nearly $200 million in potential selling pressure has entered the market.
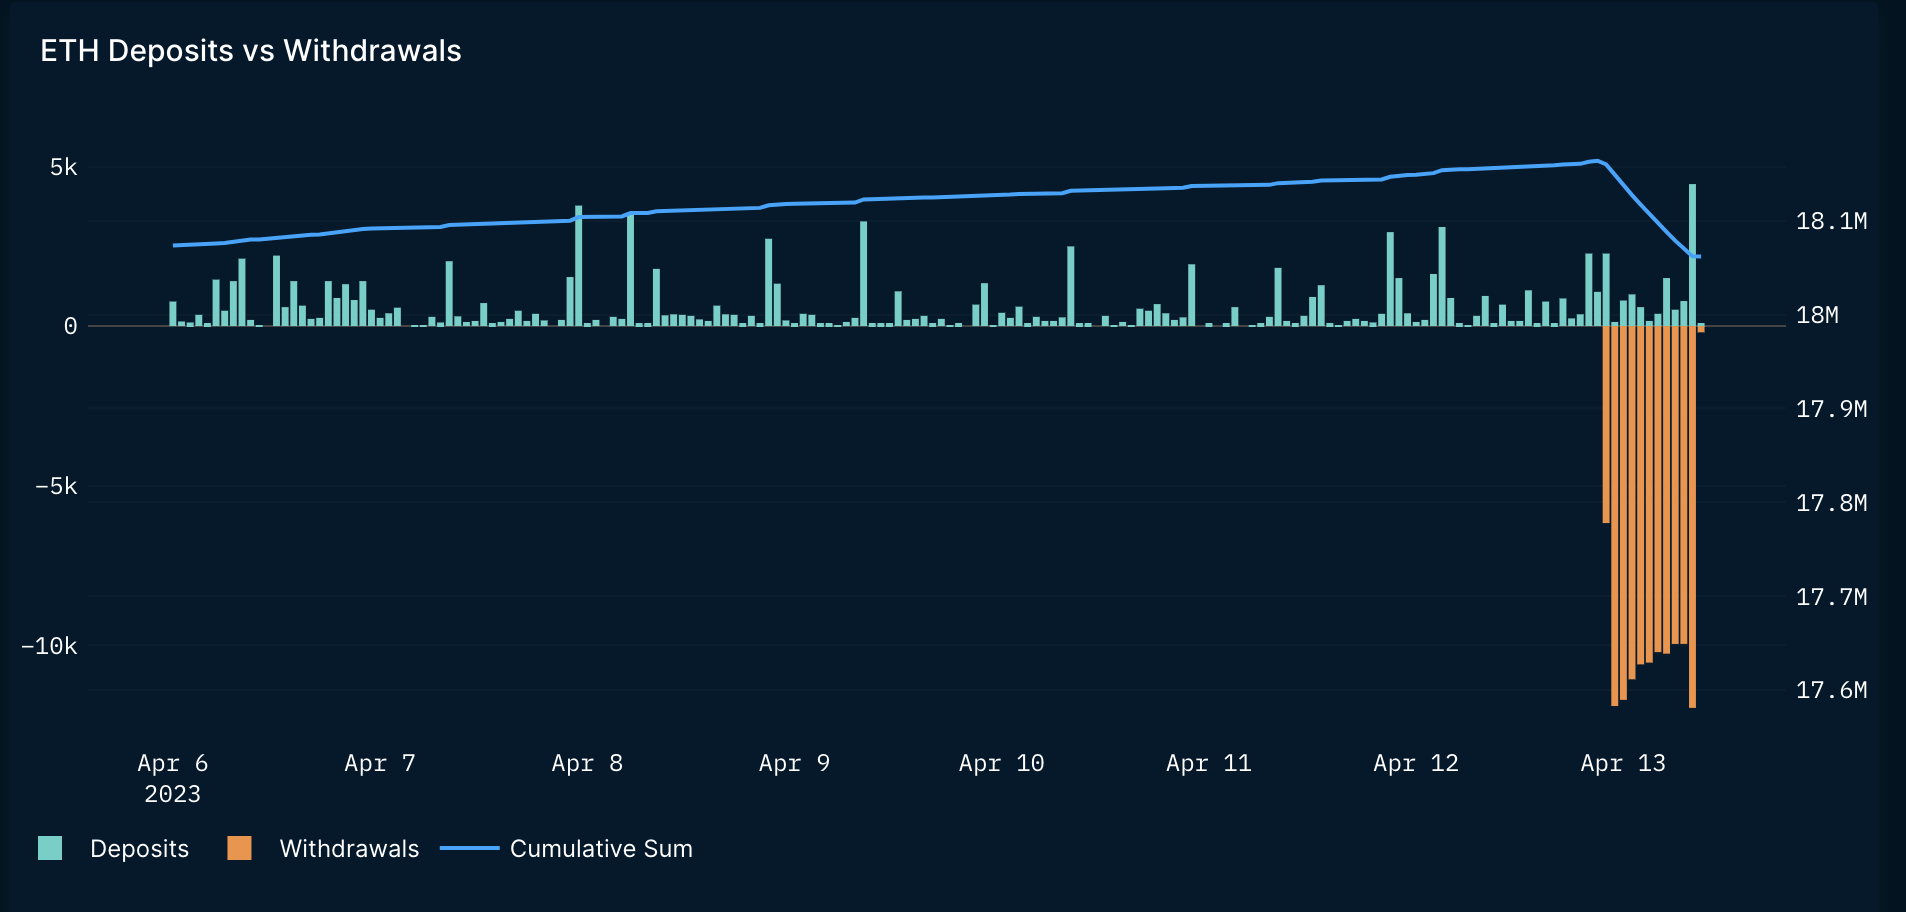
But Ether’s price rise since the Shanghai launch suggests that the market had no problem absorbing any selling pressure arising from this event so far. It’s also possible that most users have decided to hold onto their ETH staking rewards rather than sell them in anticipation of further gains.
About 15% of Ethereum’s total supply in circulation, nearly 120.4 million ETH, is currently staked.
Interestingly, more than 70% of the ETH staked is still underwater compared to current price levels, according to data gathered by Dune Analytics. This reduces the possibility of a sell-off in the near term from Shanghai’s staking withdrawals.
Ethereum price risks 10% correction
The ongoing run-up in the Ethereum market has left ETH/USD slightly overbought, raising the likelihood of a short-term price correction this month.
Related: When levees break, liquidity flows — Analyzing Ethereum Shapella and liquidity staking derivatives
Notably, ETH’s daily relative strength index (RSI) is merely two points below its overbought threshold of 70. In addition, ETH/USD tests a critical resistance level near $1,990, which in May 2022 and August 2022 preceded price pullbacks.
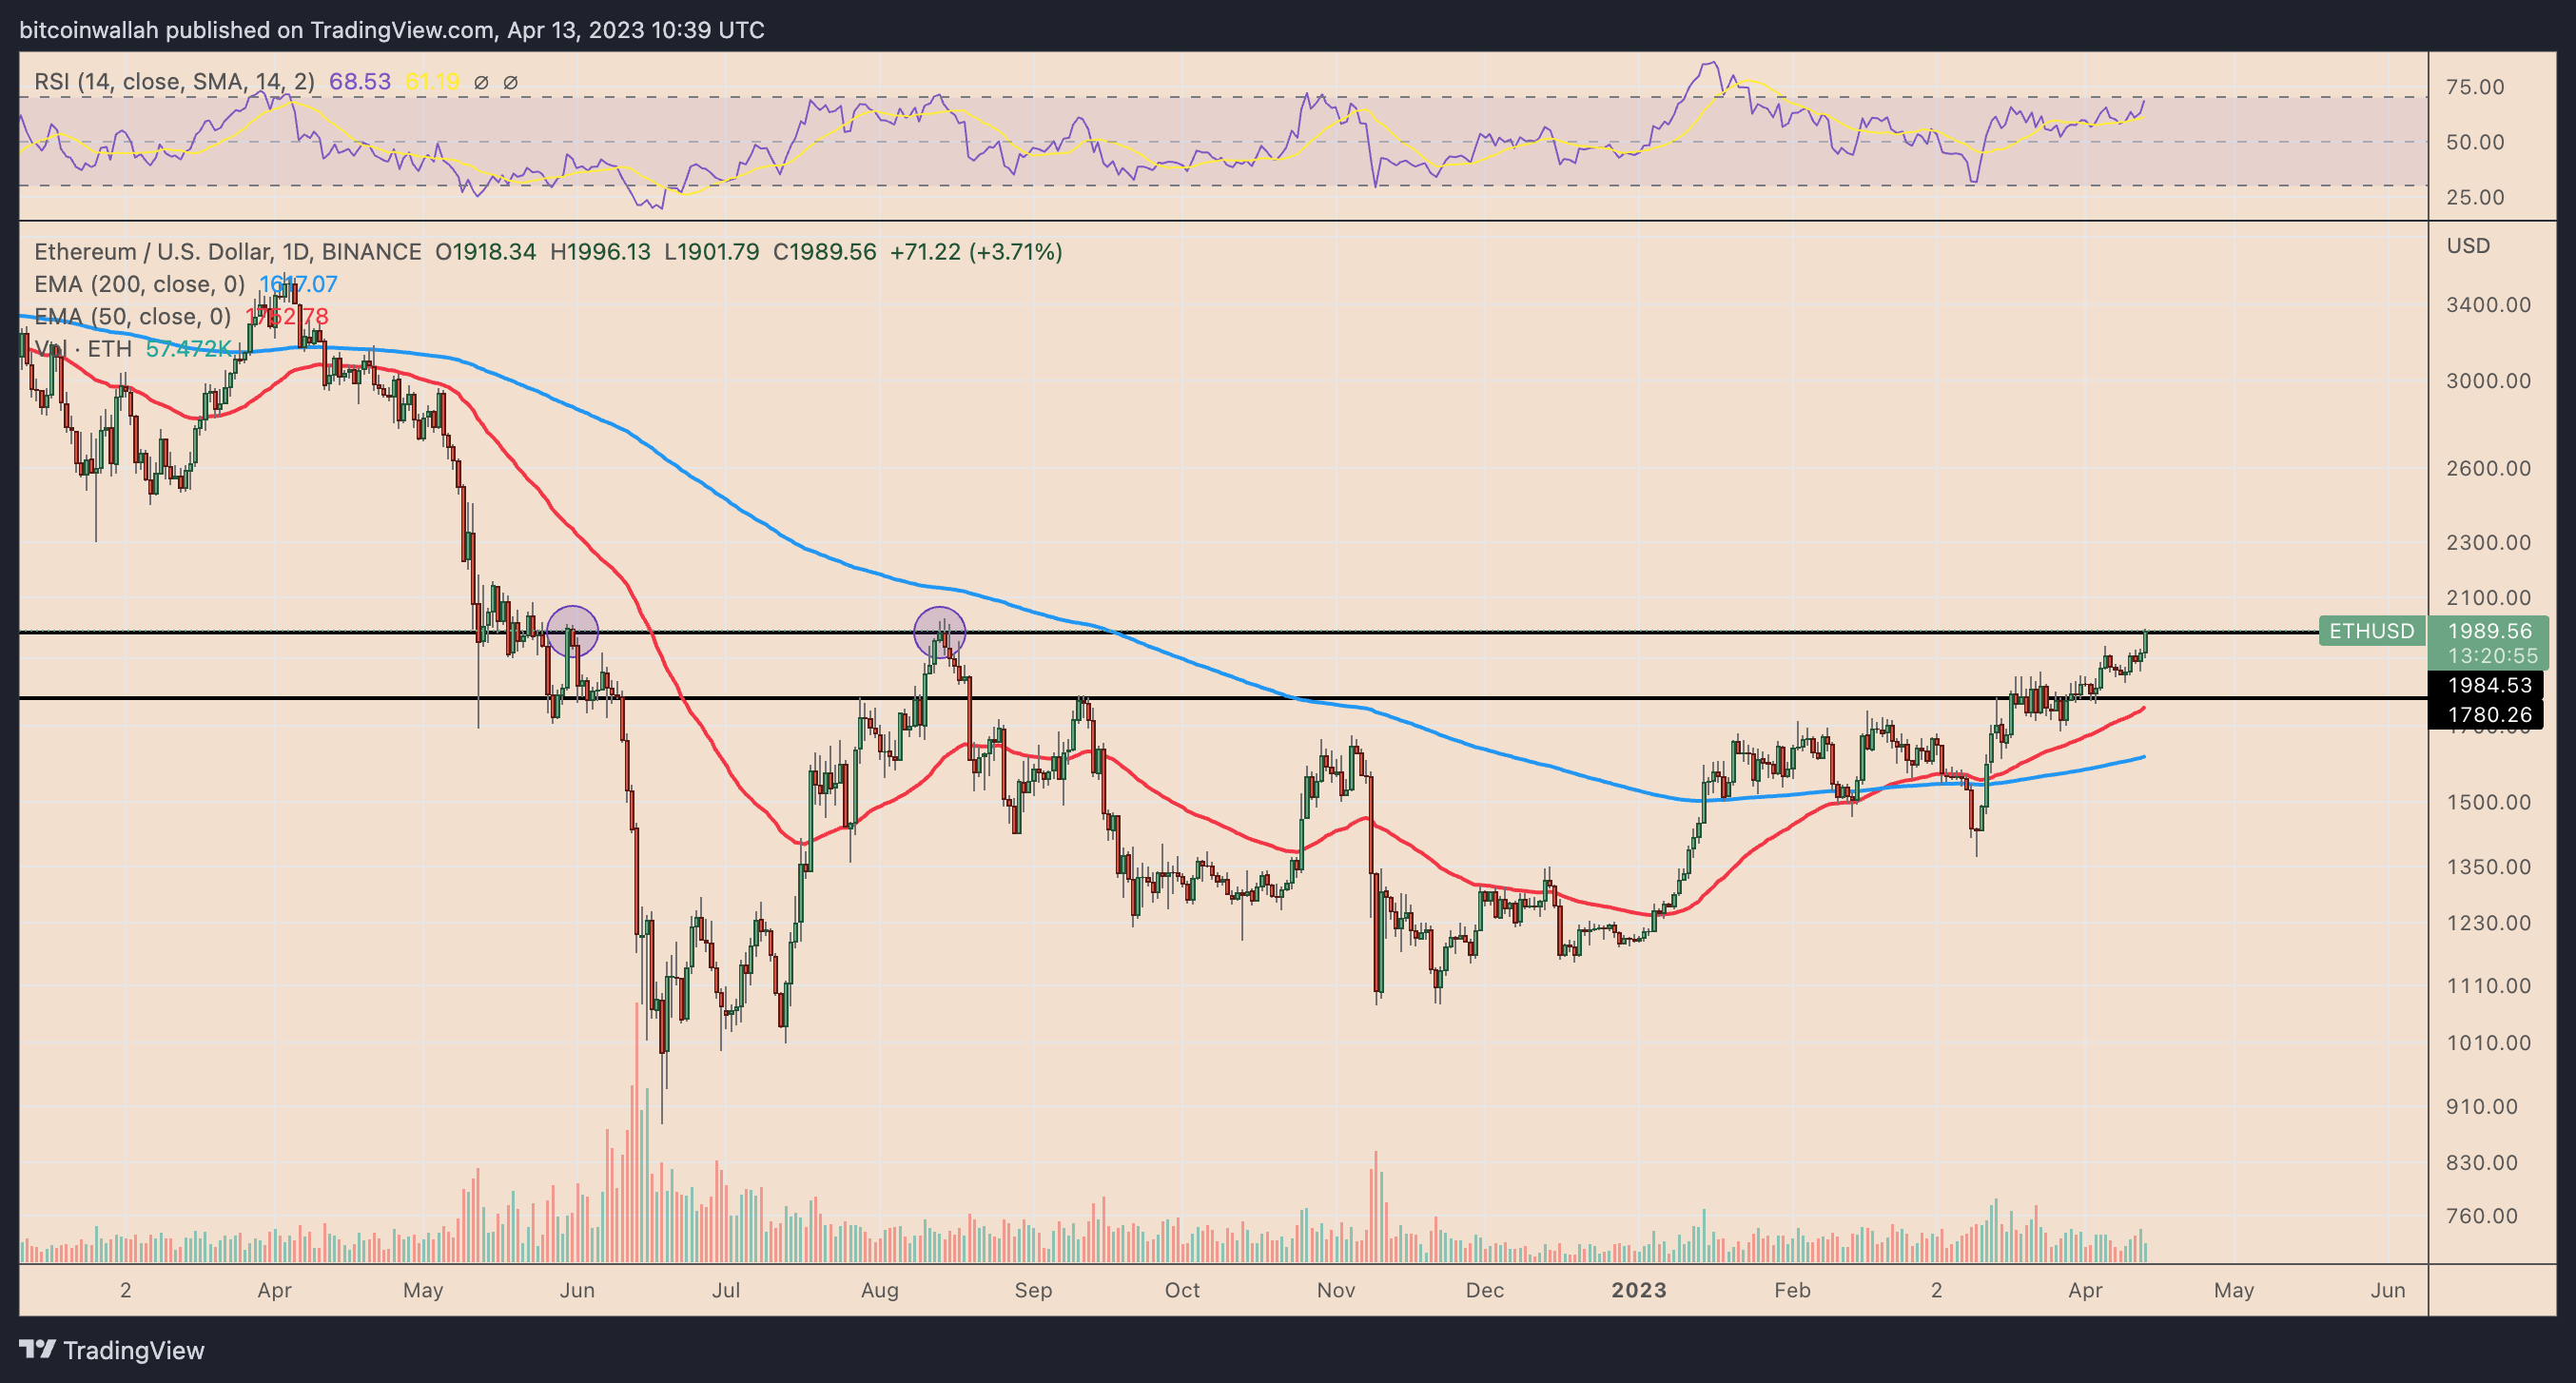
A repeat of this scenario likely means a correction toward its 50-day exponential moving average (50-day EMA; the red wave) near $1,750 in April, down about 10% than the current price levels. This ETH price level is also close to the historical support/resistance line.
Conversely, a decisive breakout above $2,000 — a psychological resistance level — could have Ether price start its potential…
Click Here to Read the Full Original Article at Cointelegraph.com News…