The price of Ethereum’s native token, Ether (ETH), has recovered 78% since June 2022. But this doesn’t guarantee further upside, particularly with declining trading volumes suggesting that the risk of a major correction is high.
Ether volume profile drops 90% since March 2020
A “volume profile” indicator displays trading activity across prices, with the blue indicating buying volume and the yellow indicating sell volume.
In March 2020, when the market bottomed, Ether’s volume profile on a weekly chart showed about 160 million ETH trades across the $85–$270 price range. At the time, the selling volume was greater than the buying volume by around 4 million ETH.
But Ether buying volume regained momentum after ETH price rallied above $270 in July 2020.
Notably, between July 2020 and November 2020, the Ether volume profile displayed about 64.25 million ETH trades across the $270–$450 range, with buying volume exceeding selling volume by almost 1 million ETH.
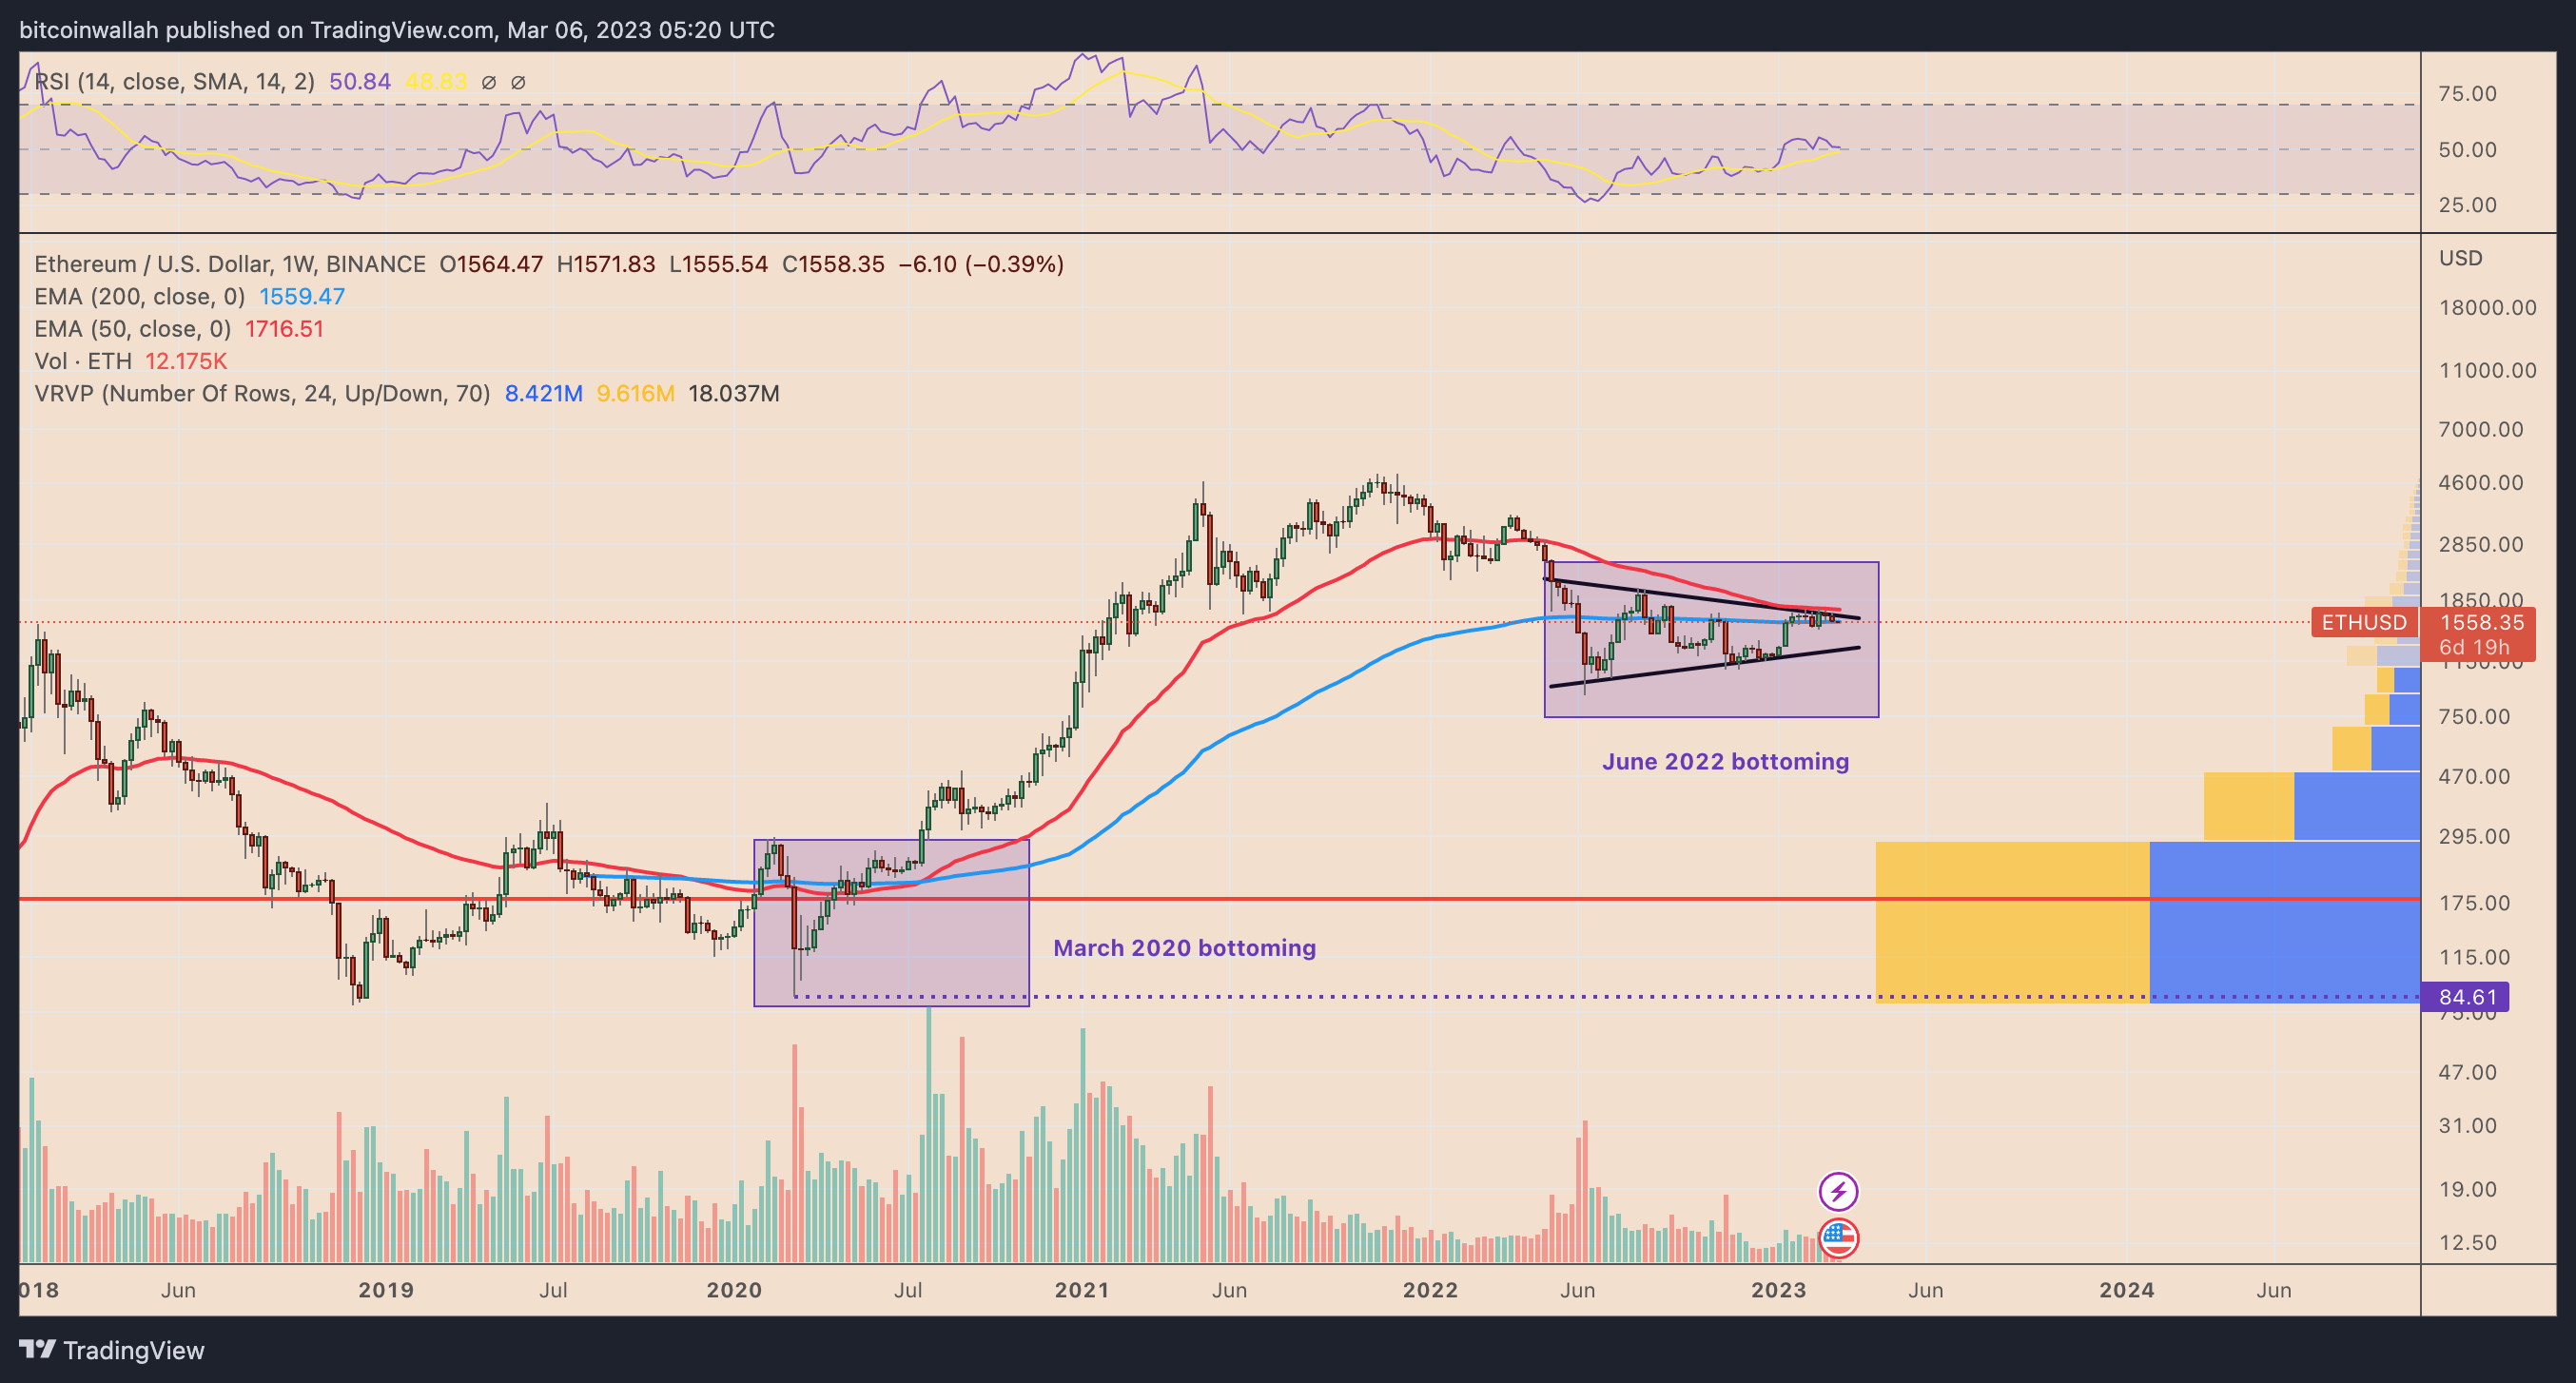
The price-volume trend remained largely synchronous with one another until November 2021, when ETH/USD reached its record high at around $4,950.
In other words, most traders purchased Ether as its price climbed, illustrating their confidence in the longevity of the bullish reversal that followed the March 2020 crash.
However, that confidence is missing in the 2023 Ether market rebound.
2022 ETH price bottom differs from two years ago
At first, the Ether volume profile at the beginning of it price recovery in June 2022 from $900 shows 12.50 million ETH trades, down more than 90% from March 2020.
But despite a 75% price recovery, fewer traders have been participating in Ether’s potential bottom this time around when compared with the beginning of the 2020 bull market.
What’s further concerning is the rising sell-volumes during the current ETH price rebound.
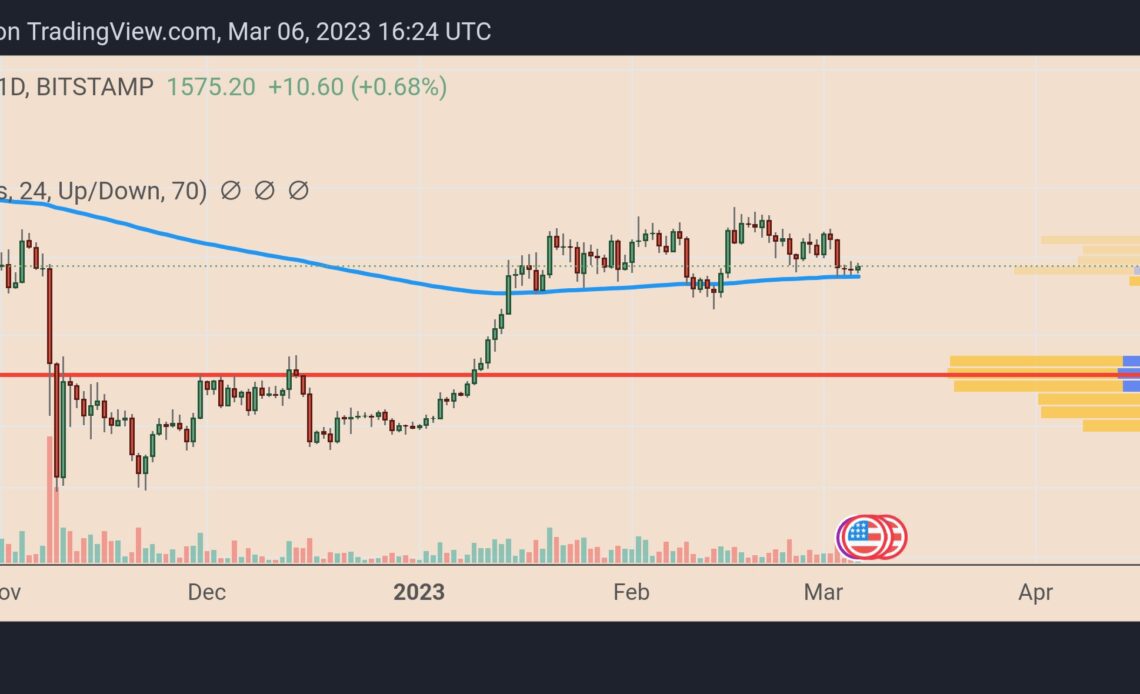
For instance, the red horizontal line in the daily chart below, dubbed the “point of control,” or POC — which represents the area with the most open trading positions — shows a net 8.21 million ETH volume of around $1,550, with sellers exceeding buyers by 170,000 ETH trades.

In other words, ETH’s ongoing price recovery might not have the legs it did in March 2020, especially when coupled with the overall volume profile decline over the past two years.
Most Ether investors are still in…
Click Here to Read the Full Original Article at Cointelegraph.com News…