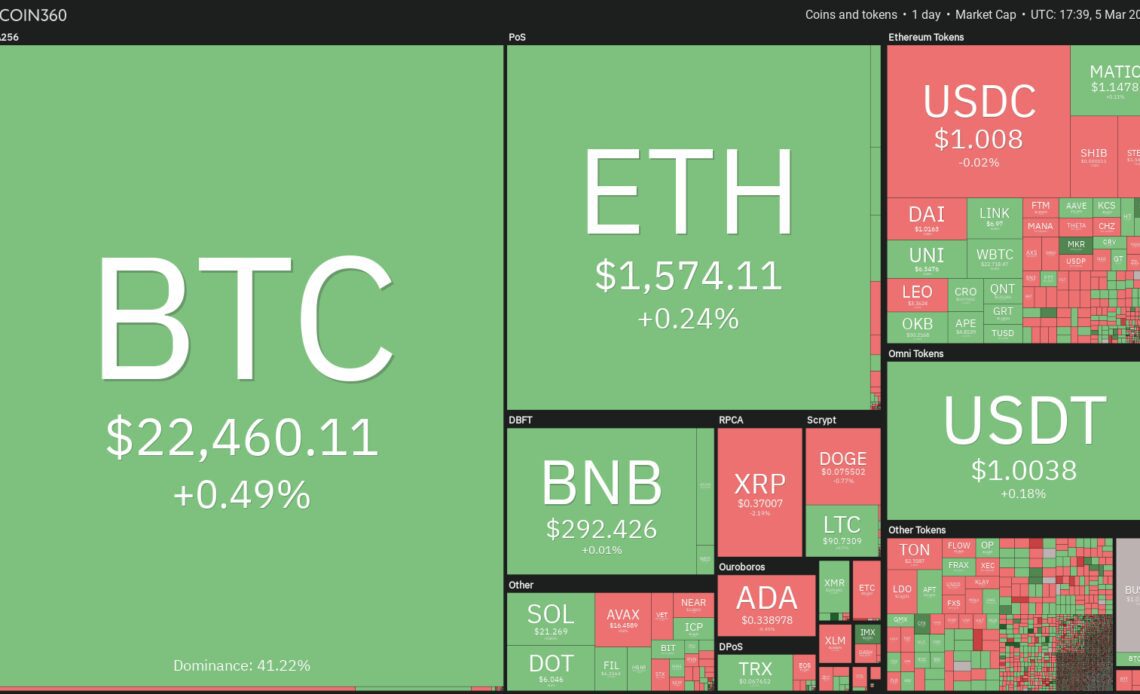
The United States equities markets made a strong recovery this week but Bitcoin (BTC) failed to follow suit. This means that cryptocurrency investors stayed away and could be worried by the ongoing problems at Silvergate bank. These fears could be what is behind the total crypto market capitalization dropping to nearly $1 trillion.
The behavior analytics platform Santiment said in a report on March 5 that there was a “huge spike of bearish sentiment” according to their bullish versus bearish word comparison Social Trends chart. However, the firm added that th “kind of overwhelmingly bearish sentiment can lead to a nice bounce to silence the critics.”
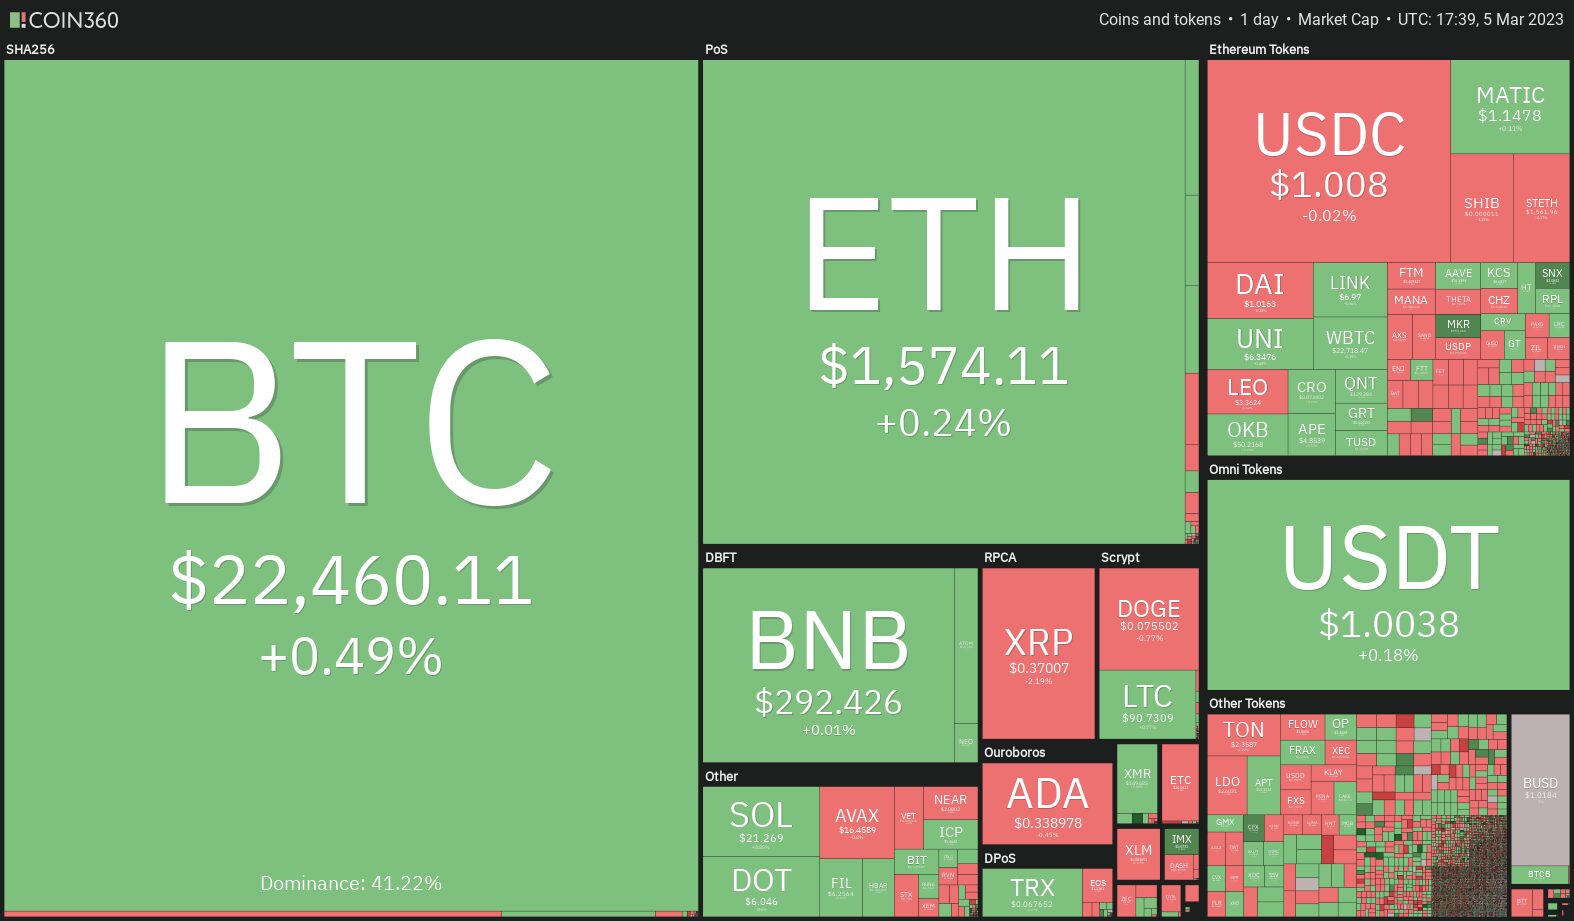
Another short-term positive for the crypto markets is the weakness in the U.S. dollar index (DXY), which fell by 0.70 in the past 7 days. This suggests that crypto markets may attempt a recovery over the next few days. As long as Bitcoin remains above $20,000, select altcoins may outperform the broader markets.
Let’s study the charts of Bitcoin and the four altcoins that are showing promise in the near term.
BTC/USDT
Bitcoin plummeted below the $22,800 support on March 3. Buyers tried to push the price back above the breakdown level on March 5 but the long wick on the candlestick suggests that bears are trying to flip $22,800 into resistance.
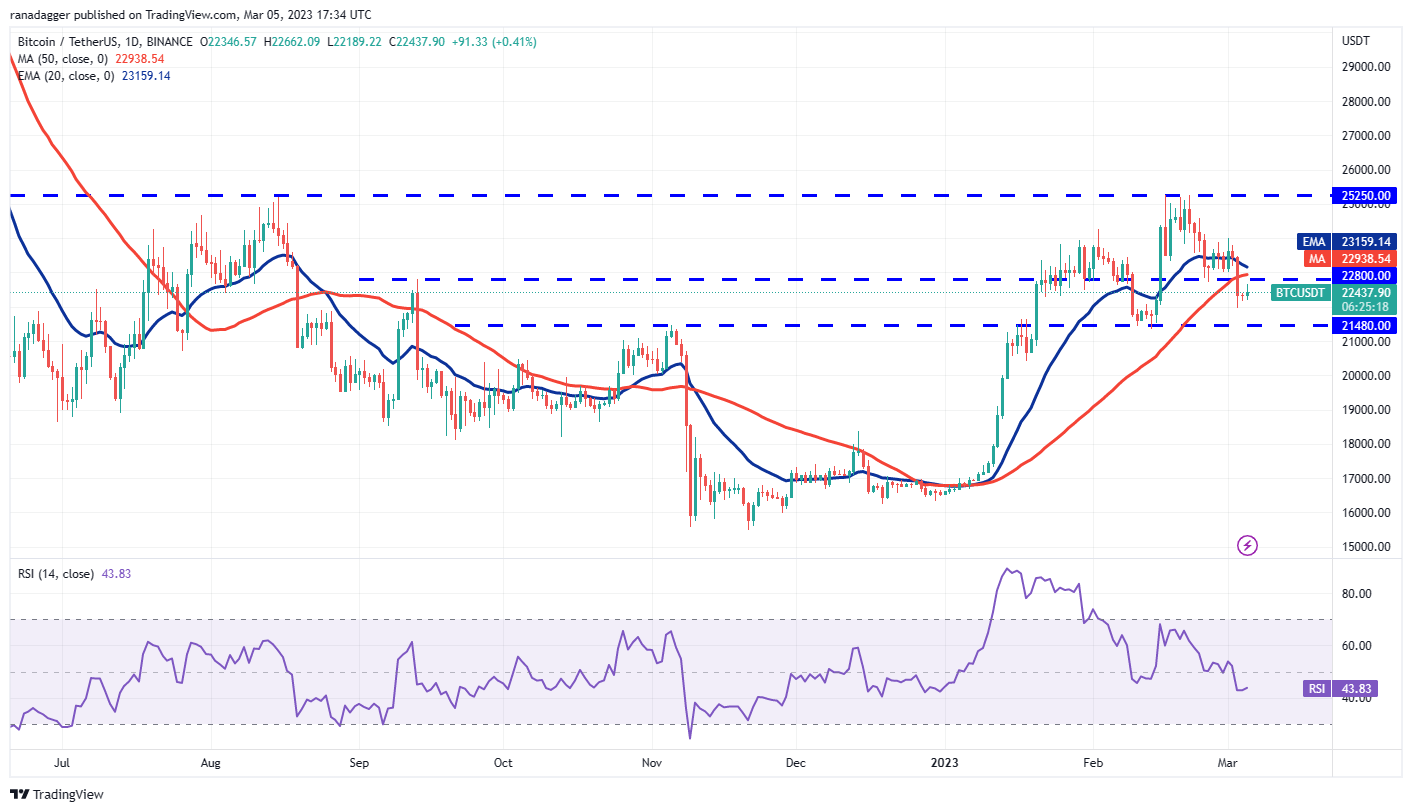
The 20-day exponential moving average ($23,159) has started to turn down and the relative strength index (RSI) is below 44, indicating that bears are trying to solidify their position. Sellers will try to sink the price below the support at $21,480. If they can pull it off, the BTC/USDT pair may retest the vital support at $20,000.
If bulls want to prevent the downside, they will have to quickly thrust the price above the 20-day EMA. Such a move will suggest aggressive buying at lower levels. The pair may then rise to $24,000 and thereafter rally to $25,250. A break above this resistance will indicate a potential trend change.
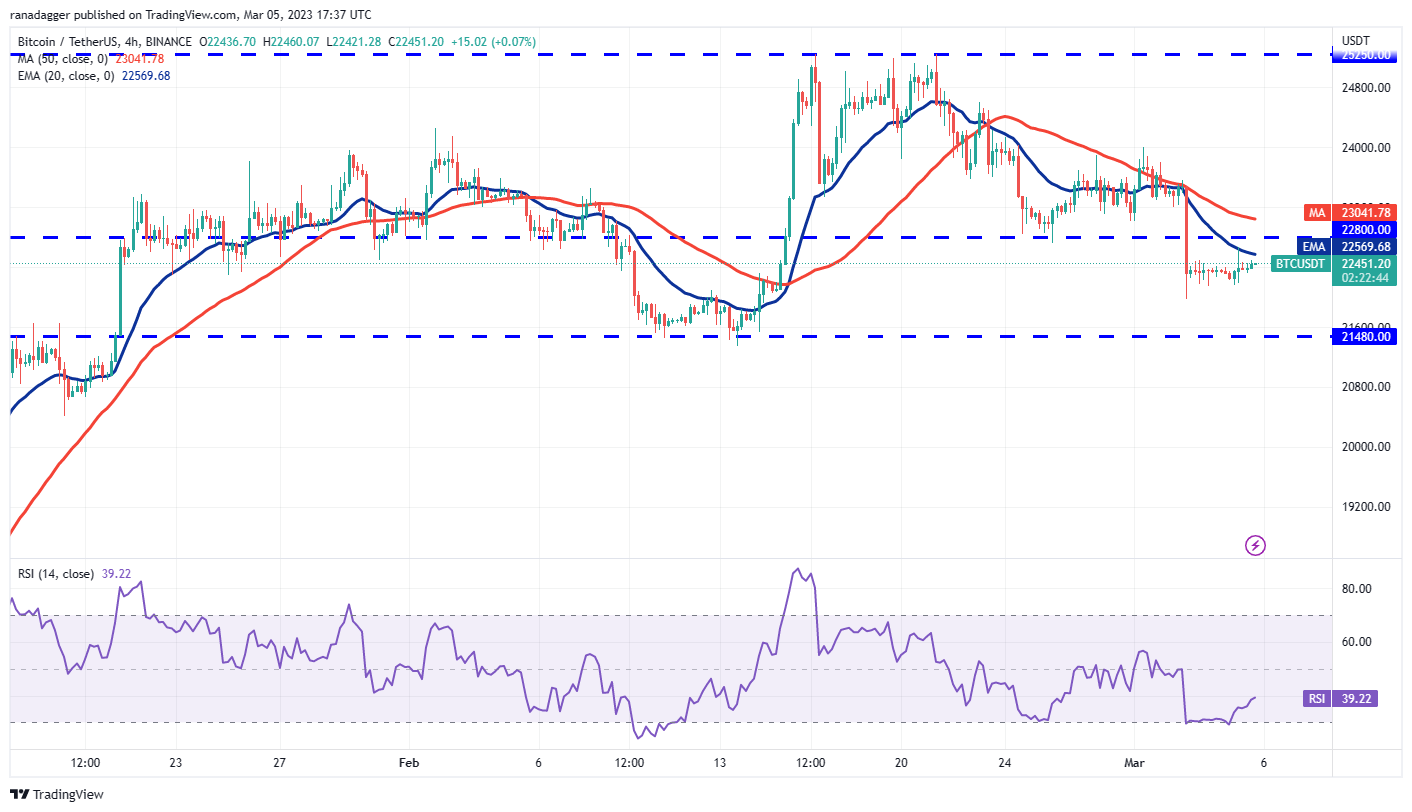
The moving averages are turning down on the 4-hour chart and the RSI is near 39. This indicates that bears have the upper hand. If the price turns down from the 20-EMA and breaks below $21,971, the pair may retest the support at $21,480.
Instead, if bulls drive the price above the 20-EMA, it will suggest that the bears may be losing their grip. The pair could then climb to the 50-simple moving average. This is an…
Click Here to Read the Full Original Article at Cointelegraph.com News…