The impact of Federal Reserve policy and Bitcoin’s higher timeframe market structure suggest that BTC price is not yet ready for a trend reversal.
Bitcoin (BTC) price continues to chop below the $22,000 level and the wider narrative among traders and the mainstream media suggests that a risk-off sentiment is a dominant perspective ahead of this week’s Jackson Hole summit.
Over the three-day symposium, the Federal Reserve is expected to clarify its perspective on inflation, interest rate hikes and the overall health of the United States economy.
In the meantime, traders on crypto Twitter continue to fantisize about a “Fed pivot” where interest hikes will be curtailed below 0.25 basis points and some form of monetary easing re-emerges, but the likelihood of the Fed adopting a dovish point-of-view in the short-term seems unrealistic, given the central bank’s 2% inflation target.
Regarding Bitcoin’s most recent price action. An old saying among traders is:
“Fade the short-term trend in favor of the long-term trend.”
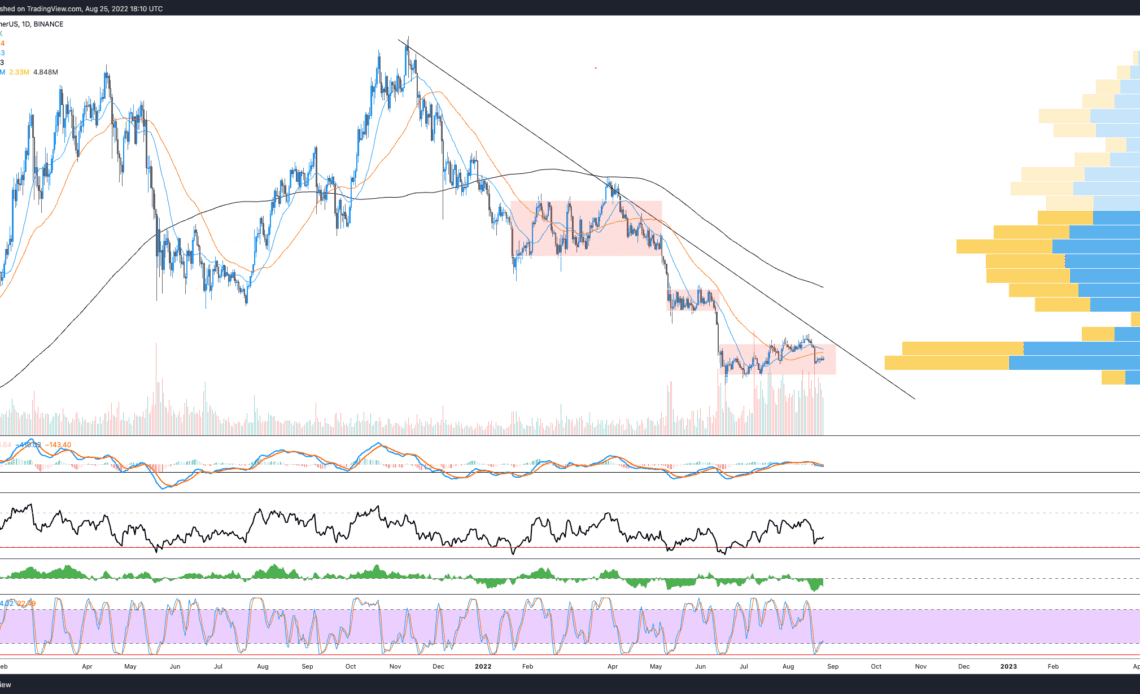
From a bird’s-eye-view, BTC price is in a clear downtrend with a four-month long stretch of recurring bear flags that continue to see continuation.
The power of the hammer. pic.twitter.com/ayxELfsBdz
— il Capo Of Crypto (@CryptoCapo_) August 23, 2022
Sure, the on-chain data hints that maybe price is at a bottom.
Of course, aggregate volumes and certain on-chain data looking at whale and shrimp BTC addresses may point toward accumulation.
Yeah, the open interest on BTC and Ether continues to reach toward record highs and this adds fuel to the bullish ETH Merge and ETH proof-of-work hard fork tokens narrative triggering a juicy short squeeze on BTC and ETH.
Any of those things can happen, but beware of the narrator of those hopium-infused dreams and remember that the trend is always a good friend that a trader can lean on.
As unpleasant as it might sound, the trend is down. Bitcoin continues to meet resistance at its long-term descending trendline and price has failed to secure resistance at key moving averages like the 20, 50, and 200-day MA.
Each price drop is simply creating a flag-pole, and the ensuing “consolidation” creates the flag of the bear flag continuation pattern. As the pink boxes on the daily chart shows, BTC price simply trades within a defined range before breaking below it into underlying liquidity shown by the volume profile visible range and liquidity maps.
$BTC…
Click Here to Read the Full Original Article at Cointelegraph.com News…