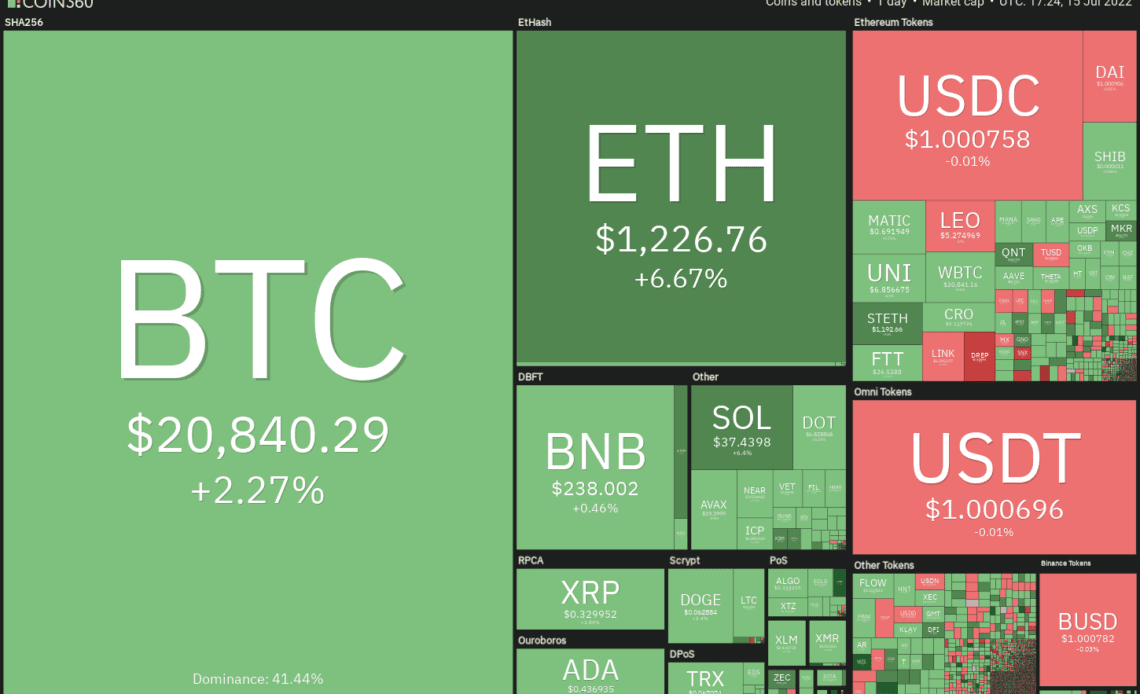
The recovery in the cryptocurrency markets is being led by Bitcoin (BTC), which has risen above the $21,000 level. However, BlockTrends analyst Caue Oliveira said that on-chain data shows a decline in “whale activity” since the month of May, barring the flurry of activity during the Terra (LUNA) — since renamed Terra Classic (LUNC) — collapse.
A survey conducted in China shows that most participants believe that Bitcoin could fall much further. About 40% of the participants said they would buy Bitcoin if the price dropped to $10,000. Only 8% of the voters showed interest in buying Bitcoin if it drops to $18,000.
Millionaire investor Kevin O’Leary told Cointelegraph that crypto markets are likely to witness “massive volatility” and enter into a state of “total panic” before entering an accelerated growth phase. He said that companies run by “idiot managers” will face the heat, but that will result in the rise of stronger companies.
Could higher levels continue to witness aggressive selling by the bears? Let’s study the charts of the top-10 cryptocurrencies to find out.
BTC/USDT
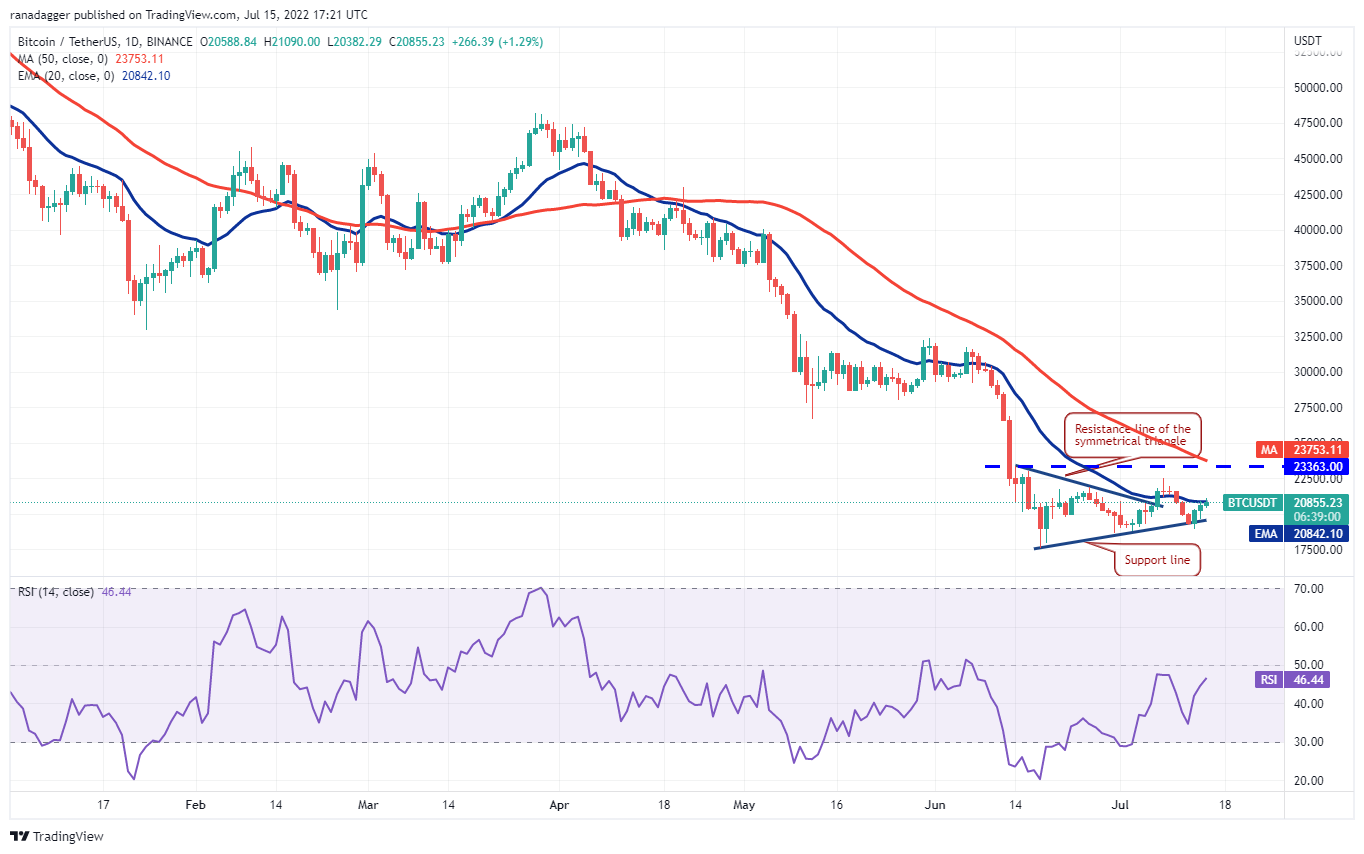
Bitcoin slipped below the support line of the symmetrical triangle on July 13, but the bears could not sustain the lower levels. This suggests that the bulls purchased the dip and have pushed the price to the 20-day exponential moving average (EMA) ($20,842).

The bulls will have to sustain the price above the 20-day EMA to indicate that the bears may be losing their grip. Above the 20-day EMA, the recovery could extend to the 50-day simple moving average (SMA) ($23,753).
A break and close above this resistance could indicate that the BTC/USDT pair may have bottomed out.
This positive view could invalidate if the price turns down from the current level and breaks below the support line. Such a move could increase the likelihood of a retest of the crucial support zone between $18,626 and $17,622
ETH/USDT
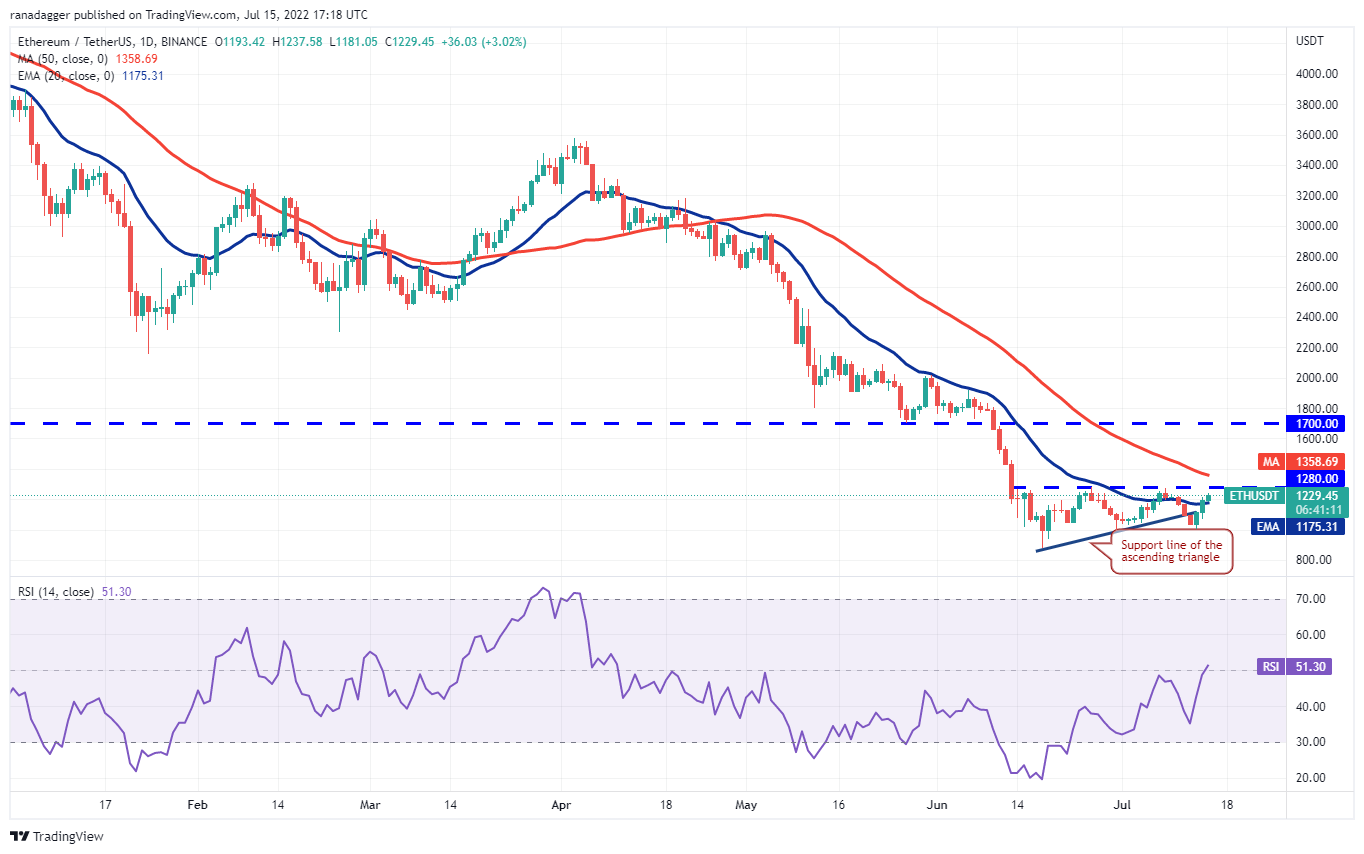
Ether (ETH) broke below the support line of the ascending triangle pattern on July 12 but the bears could not sustain the lower levels. The price turned up from $1,006 and re-entered the triangle on July 13. This suggests that the break below the triangle may have been a bear trap.

The buyers will try to propel the price above the overhead resistance at $1,280 and the 50-day SMA ($1,358). If they succeed, the ETH/USDT pair could…
Click Here to Read the Full Original Article at Cointelegraph.com News…
